
More Than 42 Million US Households Were Cost Burdened in 2022
The number of cost-burdened households in the US rose dramatically during the pandemic and in 2022 reached levels not seen since 2011, according to our analysis of recently-released data from the US Census Bureau.
In total, 42.0 million households were cost burdened in 2022, paying more than one-third of their income for housing. This is an increase of 1.5 million household from 2021 and 4.9 million since 2019, the year before the pandemic started. As a result, nearly one-third of all households in the US now are cost burdened, the highest rate since 2015.
The increases, driven by several years of surging rents and unprecedented growth in home prices, occurred among both renter and homeowner households. The number of cost-burdened renter households rose to a record 22.4 million, up from 21.6 million in 2021 and 20.4 million in 2019 (Figure 1). Nearly 80 percent of the increase since 2019 was concentrated in renter households that were severely cost burdened, spending more than 50 percent of their income on housing.
Figure 1: Following a Substantial Increase, a Record-High Number of Renters Were Cost Burdened in 2022
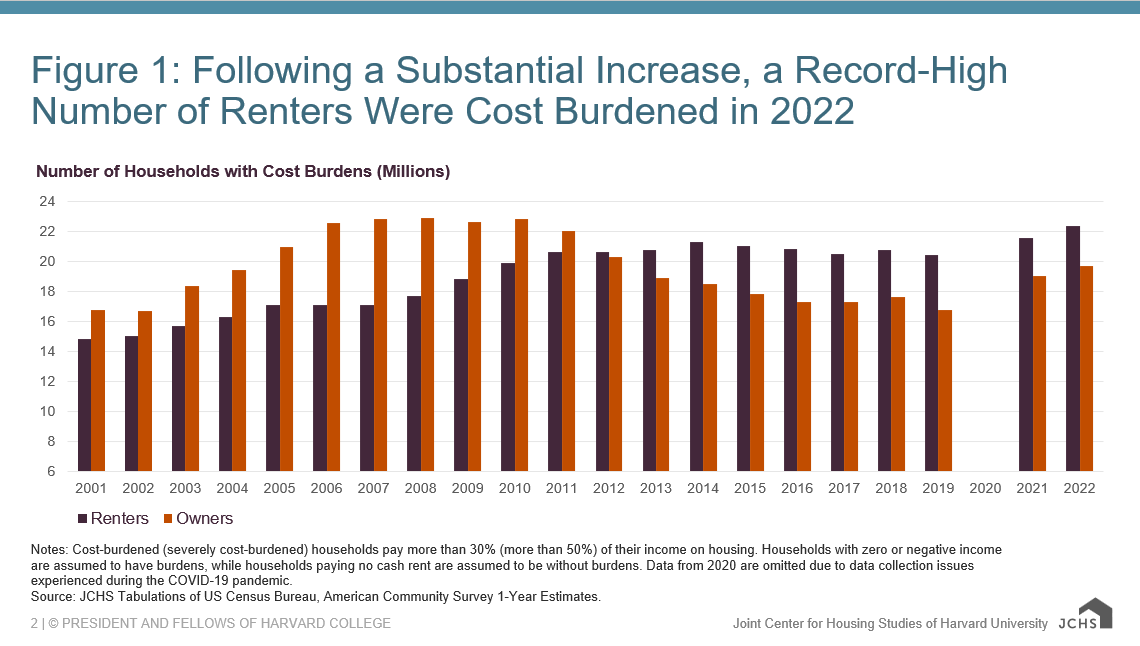
Notes: Cost-burdened (severely cost-burdened) households pay more than 30% (more than 50%) of their income on housing. Households with zero or negative income are assumed to have burdens, while households paying no cash rent are assumed to be without burdens. Data from 2020 are omitted due to data collection issues experienced during the COVID-19 pandemic.
Source: JCHS Tabulations of US Census Bureau, American Community Survey 1-Year Estimates.
The number of cost-burdened homeowners also increased, rising to 19.7 million households, more than any year since 2012 and up from 19.0 million in 2021 and 16.7 million in 2019. Fully two-thirds of the increase was among homeowners who are severely cost-burdened.
Affordability worsened for renters at every income level but has deteriorated most rapidly for moderate-income earners. Between 2019 and 2022, cost burden rates rose an astounding 5.4 percentage points for renter households earning between $45,000 and $74,999 annually (Figure 2). As a result, 41 percent of these households were cost burdened. Affordability issues increasingly impact these higher income households because renters at this income level are also less likely to qualify for public support. Still, lower-income households continue to bear the worst affordability issues; over four-fifths of renters with incomes under $30,000 were cost burdened in 2022, with most facing severe burdens.
Figure 2: Cost Burdens Increased for Households at all Income Levels, with Moderate-Income Renters Impacted Most
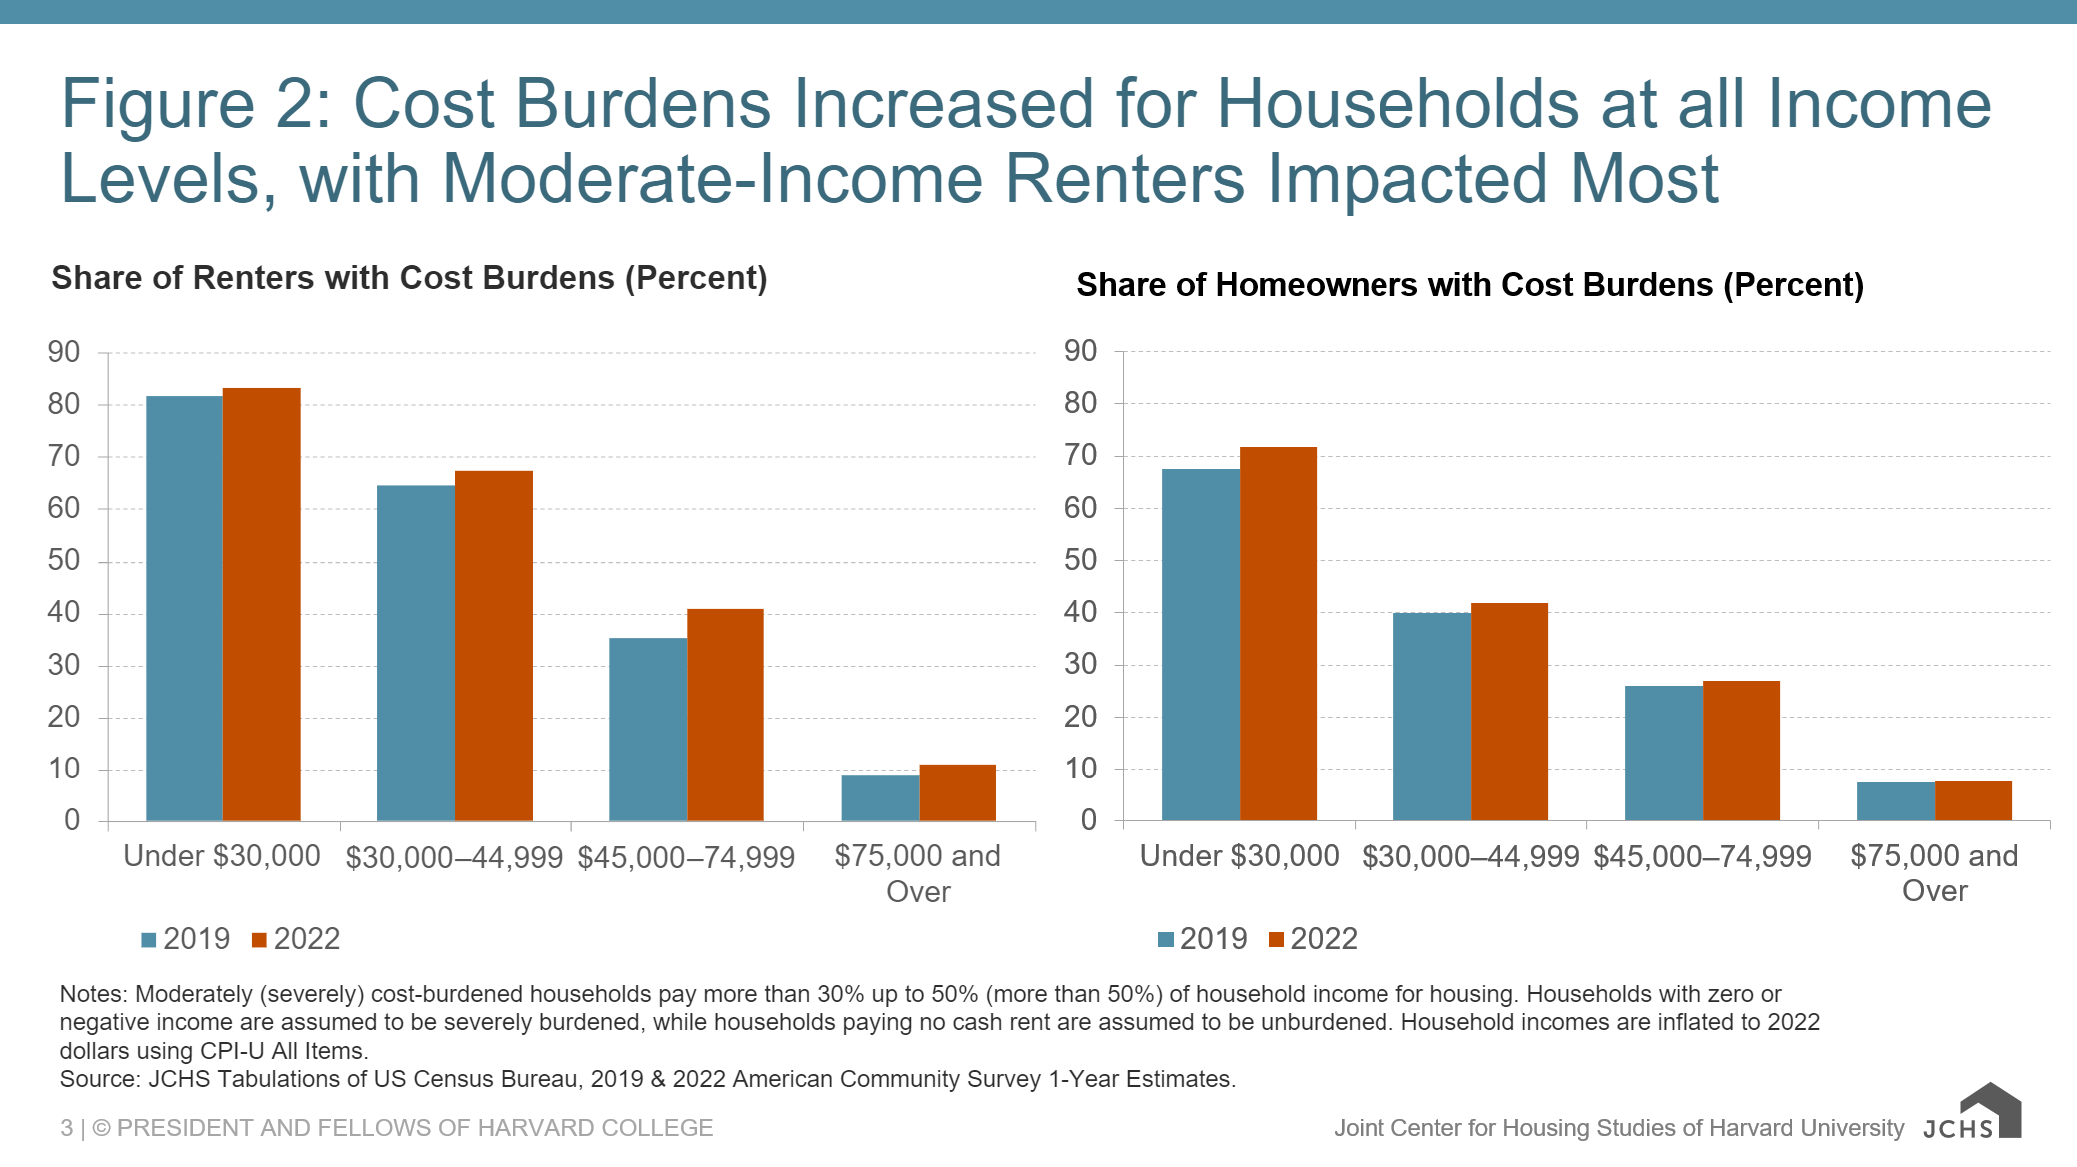
Notes: Moderately (severely) cost-burdened households pay more than 30% up to 50% (more than 50%) of household income for housing. Households with zero or negative income are assumed to be severely burdened, while households paying no cash rent are assumed to be unburdened. Household incomes are inflated to 2022 dollars using CPI-U All Items.
Source: JCHS Tabulations of US Census Bureau, 2019 & 2022 American Community Survey 1-Year Estimates.
Cost burden rates also increased for homeowners at every level of income, though most significantly for lower-income homeowners. Indeed, cost burdens for homeowners earning less than $30,000 have risen since 2019 by 4.2 percentage points to fully 72 percent in 2022. In comparison, cost burden rates for homeowners earning $30,000-44,999 and $45,000-74,999 rose a modest 2.0 and 1.0 percentage points, respectively, while cost burdens increased just 0.3 percentage points for higher-income homeowners. Worsening affordability for low-income homeowners was driven by a growing population of older adults on fixed incomes; the share of homeowners over age 65 increased much faster among low-income homeowners than homeowners with higher incomes. In addition, fully 62 percent of the increase in cost-burdened low-income homeowners came from those over age 65, highlighting the dearth of affordable, accessible homes for the growing population of older people.
Methodological changes since the 2020 Decennial Census preclude analyzing cost burden trends by race and ethnicity before the pandemic but cost burdens have increased for most racial and ethnic groups since 2021. Moreover, households of color continued to face outsized and persistent affordability challenges. For example, over half of renter households headed by person who was Black (57 percent), Hispanic (54 percent), or multiracial (50 percent) had cost burdens in 2022, far higher than the 45 percent of households headed by a white person (Figure 3). This includes the one-third of Black renters who were severely burdened, due in part to longstanding discrimination in housing, employment, and education that has limited housing options and earning potential for people of color. Although American Indian and Alaskan Native (AIAN) renters had the lowest rates of cost burdens among all renter households, this group is more likely to face other challenges, including overcrowding, paying higher prices for food and other goods and services, and astoundingly high rates of housing inadequacy. And while homeowners of color have lower burden rates overall than renters, they also have significantly higher affordability challenges than white homeowners.
Figure 3: Households of Color, Especially Black and Hispanic Households, Face Greatest Affordability Challenges
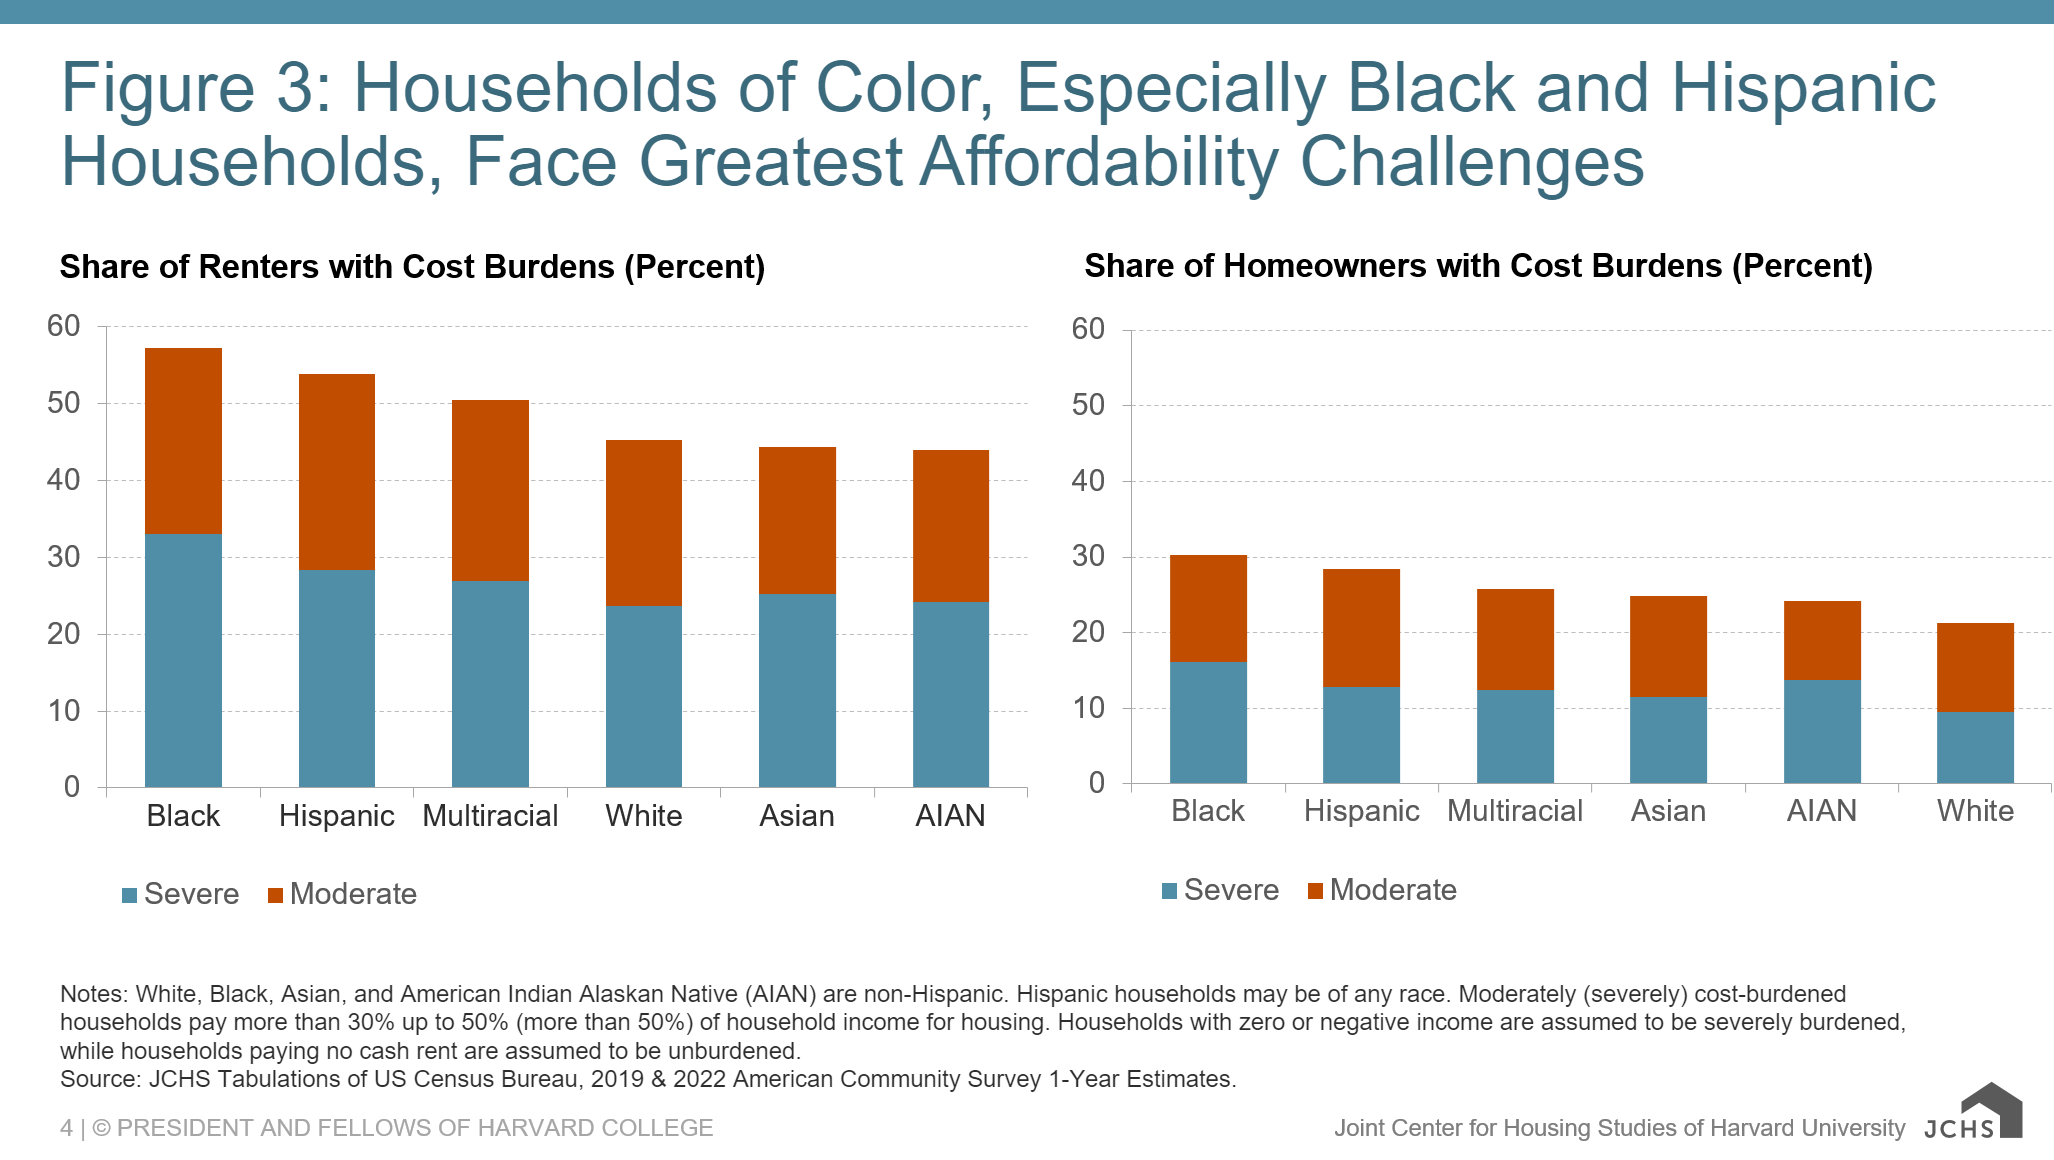
Notes: White, Black, Asian, and American Indian Alaskan Native (AIAN) are non-Hispanic. Hispanic households may be of any race. Moderately (severely) cost-burdened households pay more than 30% up to 50% (more than 50%) of household income for housing. Households with zero or negative income are assumed to be severely burdened, while households paying no cash rent are assumed to be unburdened.
Source: JCHS Tabulations of US Census Bureau, 2019 & 2022 American Community Survey 1-Year Estimates.
As the number of cost-burdened renters reached record highs, housing affordability has worsened for homeowners and renters alike, though challenges were not equally distributed across income levels and racial and ethnic groups. As discussed in our forthcoming America's Rental Housing 2024 report, households with cost burdens often face difficult tradeoffs. With Black and Hispanic households far more likely to be cost burdened, they are also more likely to face these tradeoffs than households headed by a white person, potentially forgoing food, childcare, or medication, while being unable to build emergency, education, or retirement savings. Given these tradeoffs, efforts to help cost-burdened households must not only include expanding housing assistance programs, but should include initiatives that reduce the cost of other necessities such as food, healthcare, and transportation.