
Rental Housing Unaffordability: How Did We Get Here?
As we noted in our most recent report, America’s Rental Housing 2024, the number of cost-burdened renters hit a record high in 2022 as half of all households spent more than 30 percent of their incomes on rent and utilities. The rapid increase in cost burdens since the start of the pandemic accelerated a much longer-term trend of rents outpacing incomes. While current cost burdens are high by recent standards, they are especially high when looking at affordability trends over the last 60 years. Looking at this span of time shows how two periods, the 1970s and the Great Recession in the late 2000s, fueled the modern affordability crisis. While the nation had started to see modest improvements in affordability as incomes rose during the last half of the 2010s, the pandemic once again worsened conditions at a rate not seen since the housing bubble burst.
Rental housing was relatively affordable in the 1960s and the beginning of the 1970s when about a quarter of all renters were cost burdened (Figure 1). Severe burdens were also rare, with less than 14 percent of renters spending over half of their incomes on rent in both 1960 and 1970. The 1970s brought a recession that created the first large gap in renter affordability. Income inequality heightened, inflation outpaced the growth in renters’ incomes, and multifamily starts slowed abruptly. By 1980, the cost burden rate hit 35 percent with more than half of those renters experiencing severe burdens.
Figure 1: Renter Cost Burdens Have Increased Dramatically Over the Last Six Decades
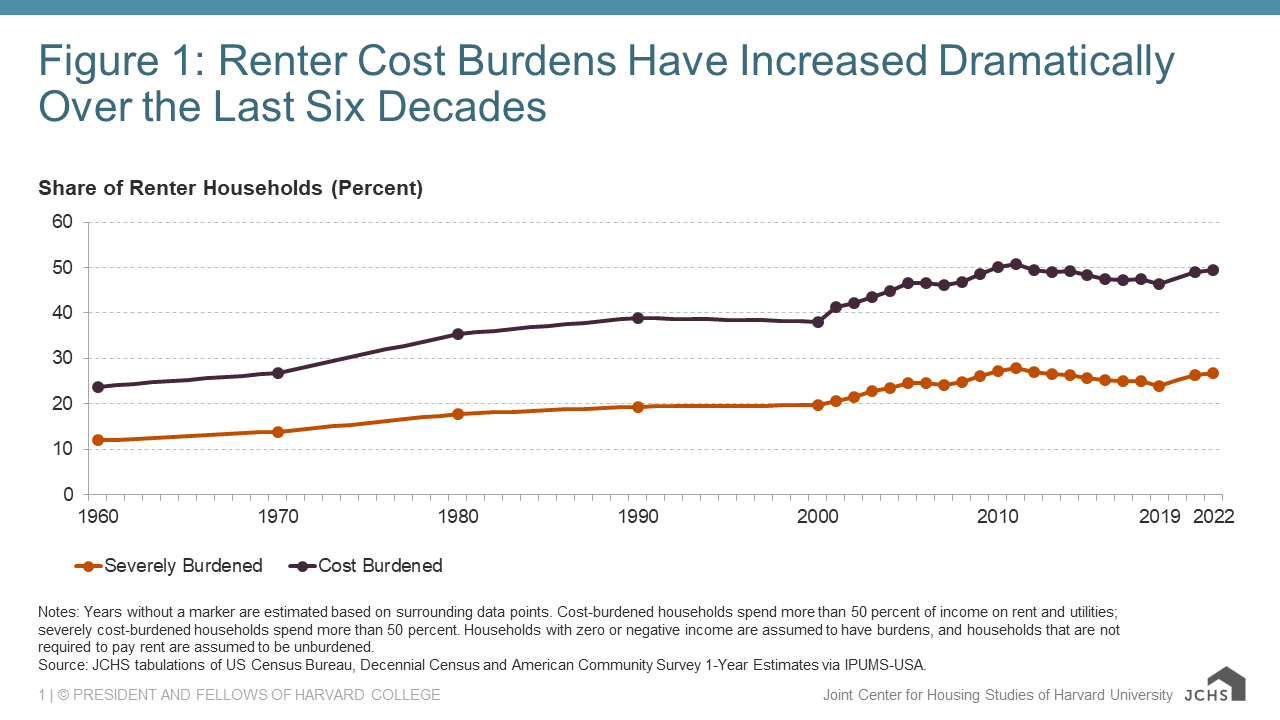
The economic boom that started in the 1980s and continued well into the 1990s gave renter incomes a boost, but rents also continued their steady rise during this period. Cost burden rates hovered around 38 percent as severe burdens held at about 19 percent before unaffordability started its steady creep during the early 2000s. Even before the Great Recession, renter household incomes were declining, in part due to the short-lived 2001 recession that had a long tail for recovery, and rents climbed upward as the number of renter households increased and multifamily completions remained relatively stagnant. At the start of the Great Recession in 2008, the renter cost burden rate hit 47 percent with a quarter of all renters facing severe burdens.
The Great Recession propelled cost burdens to new heights. Renters’ incomes fell, and an influx of foreclosed households into the rental market put upward pressure on rents, especially as developers put the brakes on new construction. In the three years from the start of the recession to the start of the recovery, cost burdens rose by 3.9 percentage points, peaking in 2011 at 51 percent. Severe burdens also hit an all-time high of 28 percent during this period.
The depth of the Great Recession meant that cost burdens remained elevated for several years with modest improvements just starting to be realized before the pandemic once again widened the gap between renters’ incomes and the cost of housing. Cost burden rates were trending downward from 2014 to 2019, falling from 49 percent to 46 percent. The pandemic completely undid these gains, pushing cost burdens up at a pace not seen since the Great Recession. From 2019 to 2022, cost burden rates rose by 3.2 percentage points, a swift change from the trajectory the country had been on but still dwarfed by the increases during the Great Recession. The starting point of fairly high unaffordability in 2019, though, meant that cost burden rates neared the 2011 peak, hitting 50 percent in 2022.
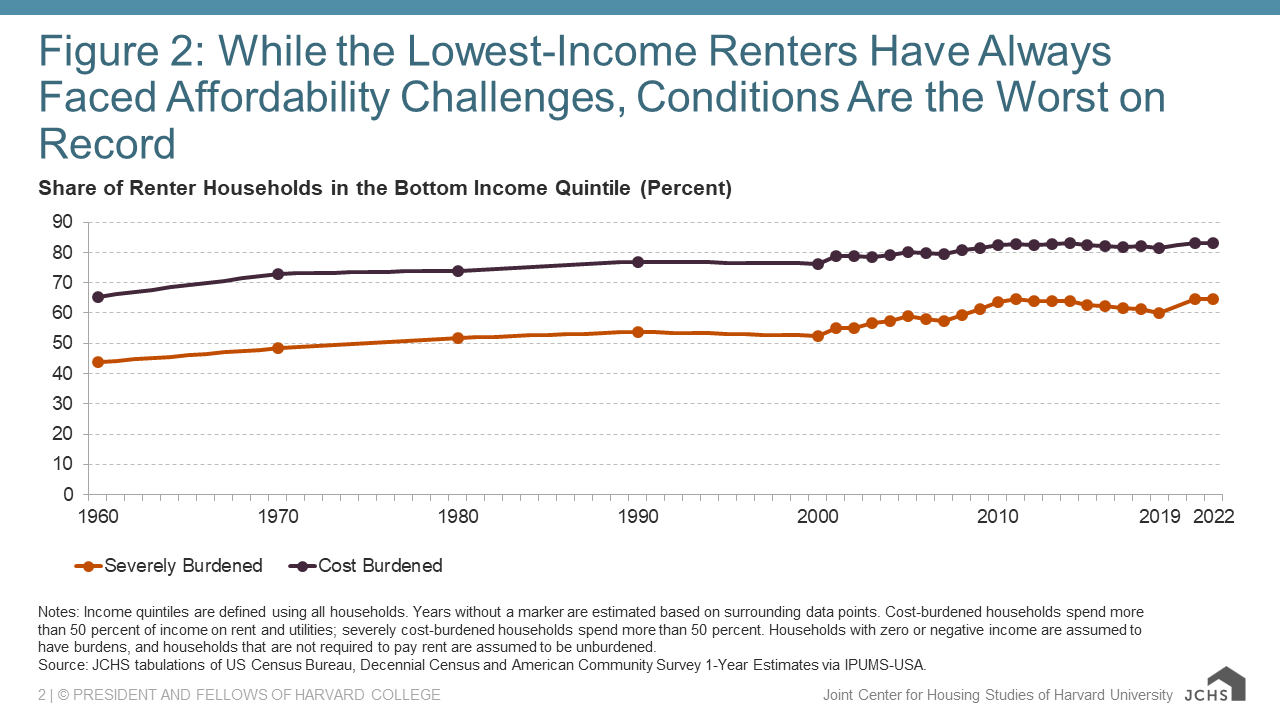
While current cost burden rates are just below the all-time high, the lowest-income renters are faring worse than ever before (Figure 2). Renters in the bottom fifth of all household incomes had a cost burden rate of 83 percent in 2022, including 65 percent who had severe burdens. This was an increase of more than 20 percentage points since 1960, with all of the worsening affordability for this group coming in the form of severe burdens. For renters in poverty, conditions are even worse. A full 72 percent of renters living in poverty were severely cost burdened in 2022. On average, impoverished renters spent an astounding 78 percent of their incomes on housing costs, up from 54 percent in 1960.
Figure 2: While the Lowest-Income Renters Have Always Faced Affordability Challenges, Conditions Are the Worst on Record
The net effect of this longer history is that renters today spend much more of their incomes on rent than they did in previous generations. The median renter household in 1960 spent less than a fifth of their income on rent. By 2022, housing costs consumed 31 percent of the median renter’s income. And in inflation-adjusted terms, the median rent is up 75 percent over these six decades while the median renter income has risen by just under 15 percent.
Stubbornly high cost burden rates have characterized the modern era of rental unaffordability. Renters have struggled through periods of economic volatility, seeing income gains in some years but increasingly falling behind the rising cost of housing that has been continually pushed up by growing demand and periods of inadequate construction levels. Through all of this, the federal policy response has fallen well short of the need. Not only have cost burden rates increased, but the magnitude of the problem has also grown considerably. While the number of households eligible for rental assistance increased from 10.7 to 19.3 million between 1978 and 2021, the number of assisted households rose from just 2.1 to 5.1 million. Breaking stagnant affordability trends will require robust funding from all levels of government, improved construction techniques and productivity, and a firm commitment to remove barriers to affordable housing construction.