Domestic Migration Drove State and Local Population Change in 2021

With national population growth at a record low, domestic migration was the key component of population change on the state and local levels in 2021. That was one of the main demographic findings of our State of the Nation’s Housing report released this June. As the report’s interactive population change map shows, population grew in most states with net domestic inflows (more people moving into the state than out, not including immigrants), while population typically shrank in states with net domestic outflows (Figure 1). In most states, domestic migration outpaced net international immigration and natural population change (births minus deaths), both of which were declining in recent years before falling sharply in the first year of the pandemic.
Figure 1. Migration and Population Change Varied by State During the Pandemic
This state-level map illustrates regional preferences for the Sunbelt and southeast in particular. Florida had the highest net inflows, with 221,000 more people moving in than out between July 2020 and July 2021, followed by Texas and North Carolina. The Mountain West was also fairly attractive to domestic migrants in 2021, along with parts of the Midwest and most of New England. The states that stand out with the largest levels of net domestic outflows are California and New York, both of which lost more than 300,000 migrants, followed by Illinois with a net outflow of 122,000 people.
County-level changes provide more nuance, however, showing some counties gaining migrants even in states with net outflows, and vice versa. As the interactive county map below shows, despite the overall net inflow in states like Florida and Texas, both states had several counties with steep outflows (Figure 2). The counties containing the cities of Miami and Orlando, for example, together had a net outflow of 61,000 people and the counties with the cities of Dallas and Houston had a combined net outflow of 89,000 people. In California, on the other hand, the counties containing the cities of Riverside and San Bernadino had a combined net inflow of 39,000 people despite the state’s overall net outflow.
Figure 2. Suburbs and Smaller Metros Benefited the Most from Domestic Migration in 2021
These county-level examples show a pattern of large urban counties losing domestic migrants and suburban areas around these counties gaining migrants. Other examples of this pattern include Nashville, TN, Charlotte, NC, Columbus, OH, Salt Lake City, UT, and the Twin Cities, MN. Of the 68 central counties of large metropolitan areas (those with at least 1 million people), fully 58 counties (85 percent) had net outflows in 2021. In stark contrast, 295 counties (80 percent) in the outlying parts of these large metro areas had net inflows.
While this pattern played out in large metropolitan areas, smaller metropolitan area counties generally gained migrants, as did non-metropolitan counties. In total, 511 counties (70 percent) in metro areas with fewer than 1 million people had net inflows in 2021, as did 1,235 counties (63 percent) outside of metropolitan areas. These both differ from pre-pandemic levels. In 2019, a slight majority—411 (55 percent)—of smaller metro counties had net inflows, much lower than the number and share in 2021. For non-metropolitan counties (which are largely rural), the difference is even more stark. In 2019, only 772 (40 percent) of these counties had net inflows, well shy of the two-thirds with net inflows in 2021. Since these rural counties are more common, you can see this difference when comparing the national county maps from 2019 and 2021 (Figure 3). The difference is especially notable in parts of Appalachia and the Northeast, where non-metropolitan counties were more likely to attract migrants in 2021.
Figure 3. Many More Rural Counties Gained Migrants in 2021 Compared to 2019
2019
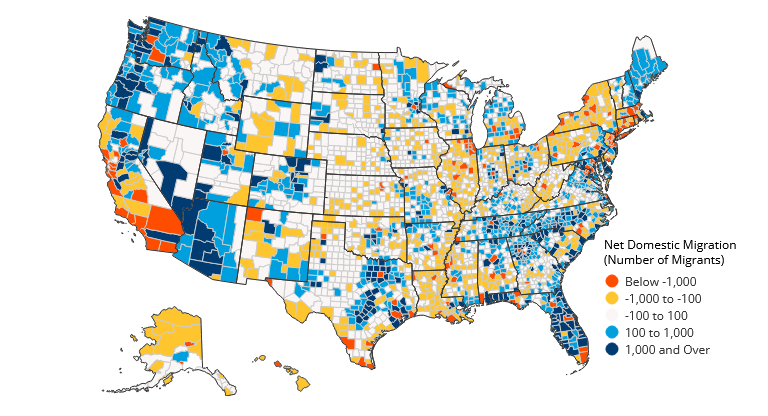
2021
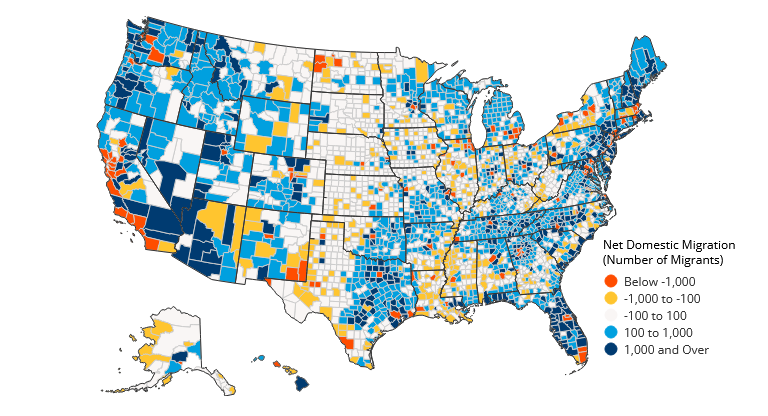
These trends are tabulated from the Census Bureau’s population estimates, which were calculated with a different methodology in 2021, warranting a note of caution. Each year, the Census Bureau estimates population changes and uses the most recent decennial Census results as a base point. When the Census was calculating the 2021 estimates, however, the full 2020 decennial results were not available due to pandemic-related delays and new data disclosure controls. Instead, the Census developed a ‘blended base’ consisting of redistricting data from the 2020 decennial census as well as other population and demographic estimates produced by the Census Bureau. Since this is a new approach, caution should be exercised when using the 2021 data, especially when comparing to estimates from previous years.
The prominence of domestic migration in state and local population change in 2021 may be due to lower levels of immigration and natural population change, to higher levels of migration, or both. Findings from data collected during the pandemic do not point to migration being much higher than usual, but there are limitations to these data sources just as there are with population estimates from 2021 (as outlined above). New data from the second year of the pandemic will hopefully reveal whether migration is on a sustained upswing or whether it is continuing a decades-long decline detailed in my previous analysis. If the former, migration will continue to play an outsized role in population change on both the state and local levels. If the latter, cities and towns may become increasingly stagnant as population change, immigration, and domestic migration all stall. Either outcome will have substantial implications for the economic and demographic landscape of the country.


