Using the Census Bureau’s Household Pulse Survey to Assess the Economic Impacts of COVID-19 on America’s Households
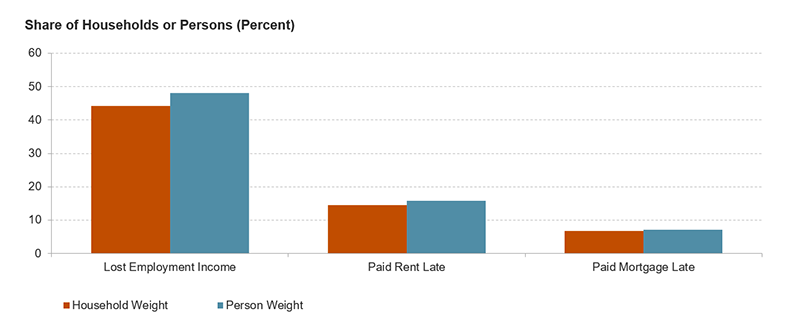
By the end of May, 44 percent of the nation’s households lost employment income as a result of the COVID-19 pandemic. Subsequently, millions have been unable to pay for their essential needs, including housing. Indeed, 7 percent of the nation’s homeowners with a mortgage and 15 percent of its renters did not make their housing payments on time in the prior month. These estimates come from the fourth week of the Census Bureau’s new Household Pulse Survey (HPS) which is meant to rapidly capture the effects of COVID-19 on Americans’ income, housing, health, and food sufficiency.
The Household Pulse Survey: Introduction and Technical Details
Despite its name, the HPS provides estimates about the adult population living in households, not households themselves. Nevertheless, it’s possible to use the HPS to produce timely and important information about the challenges households are facing. Moreover, the data tables the Census has released for the first seven weeks of the survey are often difficult to interpret concisely and precisely, in large part because of the survey’s person weights. Weights are used in survey research to make estimates derived from samples more representative of the broader population. Weights in the HPS are controlled to the distribution of the population in the 2018 5-Year American Community Survey (ACS).
By reporting these population estimates in the HPS, we don’t know how many households lost income or were unable to make their housing payments. For instance, the HPS tables for week four of the survey tell us that 16 percent of persons age 18 or over who live in renter households were late with their payment in the prior month. The comparable household estimate would simply state that 15 percent of renter households were late on their payments. Such an estimate is easier to interpret and provides a better metric for understanding the scope of the nation’s housing challenges.
To create this household estimate, we use the HPS Public Use File (PUF). Like other microdata, the PUF allows data users to create customized tabulations, impute missing data, calculate standard errors, and reweight the survey as needed. We constructed a pseudo household weight by dividing the given person weight by the number of adults in the household. These household weights allow for reasonable estimates of US households and are only possible because the person weights reported by Census are derived from internal household weights and only one adult member per household is surveyed.
Figure 1: The Share of Households in the Pulse Survey Affected by COVID-19 Is Generally Lower than the Equivalent Estimates for the Population
Note: The HPS household weight is a pseudo household weight created by dividing the given person weight in the HPS by the number of adults in the household. Weights are used in survey research to make estimates derived from samples more representative of the population.
Source: JCHS tabulations of US Census Bureau, Household Pulse Survey Week 4.
This reweighting to create household estimates is also important, as the Census’s population estimates may overestimate the impact of COVID-19 on the nation’s households. For example, 48 percent of adults lived in a household that lost employment income when using the person weights; while 44 percent of US households lost income using the household weight (Figure 1). Likewise, the share of homeowners and renters who made late housing payments were also somewhat lower when using household weights. We hypothesize that these differences occur because those most likely to suffer from a loss of income and have difficulties with their payments as a result—workers in service sector jobs, for example—will tend to live together.
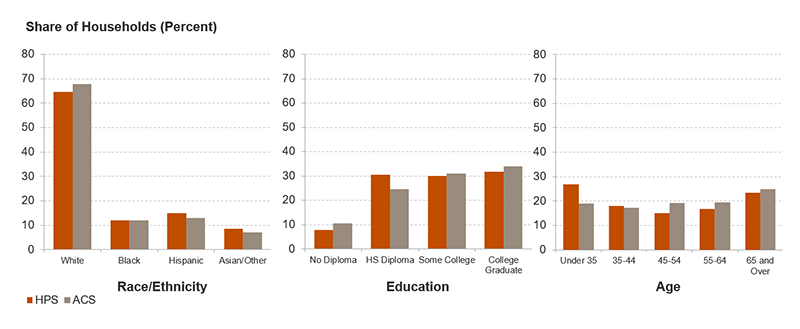
Figure 2: While the Distribution of Households in the Pulse Survey Compares Favorably to the American Community Survey Overall, Younger Households Are Overrepresented
Note: The HPS household weight is a pseudo household weight created by dividing the given person weight in the HPS by the number of adults in the household. Weights are used in survey research to make estimates derived from samples more representative of the population. White, Black, and Asian/other households are non-Hispanic. Hispanics may be of any race.
Source: JCHS tabulations of US Census Bureau, 2018 American Community Survey 5-Year Estimates and Household Pulse Survey Week 4.
The HPS household weights produce a distribution of households by tenure and some key demographic factors that align well with American Community Survey (ACS) household estimates. These comparable distributions provide an important check on the validity of our methods. Excluding nonresponses, 65 percent of households in week four of the HPS were homeowners, in line with the 63 percent share in the ACS. By race and ethnicity, 65 percent of households in the HPS were non-Hispanic white, 12 percent were Black, 15 percent were Hispanic, and 8 percent were Asian or some other race, just a few percentage points off from the equivalent estimates in the ACS (Figure 2). Low-income and lower-education households are somewhat underrepresented using the HPS household weights. Fully 17 percent of households earned under $25,000, while 8 percent lacked a high school diploma, both 3-to-4 percentage points lower than the ACS share. Younger adults, conversely, were significantly overrepresented, with households under age 35 comprising 27 percent of HPS households and just 19 percent of the ACS. Notably, reweighting produced a significant undercount of households in the HPS compared to the ACS, preventing an estimation of the absolute numbers of households affected.
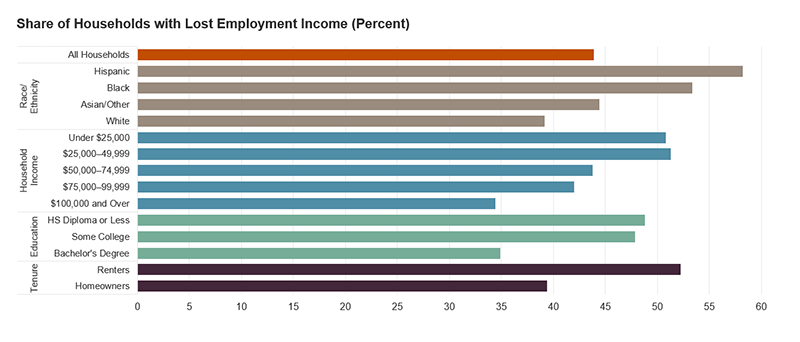
Figure 3: Minority, Low-Income, Lower-Education, and Renter Households Were More Likely to Lose Income Due to COVID-19
Notes: The HPS household weight is a pseudo household weight created by dividing the given person weight in the HPS by the number of adults in the household. Weights are used in survey research to make estimates derived from samples more representative of the population. White, Black, and Asian/other households are non-Hispanic. Hispanics may be of any race.
Source: JCHS tabulations of US Census Bureau, Household Pulse Survey Week 4.
Key Findings on COVID’s Early Economic Impact
The HPS provides extremely timely and important information about the challenges households are facing in the COVID-19 pandemic. Below we provide an overview of some core findings using our household estimates, mostly using week four of the HPS which sampled nearly 89,000 respondents across the United States at the end of May:
Minority, renter, low-income, and households without a college education were far more likely to lose employment income. Hispanic (58 percent) and Black (53 percent) households were far more likely to have lost wages than white (39 percent) and Asian/other (44 percent) households. We’ll discuss these racial and ethnic disparities in-depth in a future blog focused on this topic. Moreover, more than half of renter households (54 percent), and about half of households earning under $25,000 or with only a high school diploma reported a decline in income (Figure 3).
Millions of better-off households were also affected. Over one-third of households earning at least $100,000 and one-third of college graduates faced a decline in income. Fully 39 percent of homeowners reported a decline in income as well.
Households unable to make housing payments were also more likely to face food insufficiency. Renters (15 percent) were more likely than homeowners (7 percent) to struggle making their payments in the prior month. However, both renters and homeowners who were unable to make their payments on time were forced to cut back on other essentials. When asked if they had enough food over the past 7 days, these households said they sometimes or often did not have enough to eat. A full 26 percent of homeowners unable to make their mortgage payments on time suffered from moderate or severe food insufficiency, compared with just 4 percent of homeowners who made their payments on time. An even higher share of struggling renters (42 percent) had insufficient food, compared with 13 percent of those who paid their rent on time.
Among households who lost employment income since mid-March, the share working has increased over time. In weeks one and two, 43 percent of respondents who had lost income reported working in the prior week. By weeks four and five, that share had risen to 47 percent as businesses across the country reopened. The share stood at 50 percent in week six.
For Americans who lost income and were not working, most cite pandemic-related reasons. Among those who have lost income and weren’t working in week four, 28 percent said they weren’t working due to furlough or some other pandemic-related reduction in business. An additional 22 percent reported temporary closures of their place of employment and 15 percent reported layoffs due to the pandemic. Smaller shares of respondents reported needing to take care of a child who wasn’t in school or daycare (7 percent) or had the Coronavirus themselves (2 percent).
These early findings show how the economic impacts of the COVID-19 pandemic have been incredibly broad across the US economy. Yet some groups have been disproportionately affected. Minority, renter, lower-income households, and households without a college degree were more likely to suffer a decline in income and struggle to pay for their housing. This crisis demands timely, detailed data, and the Household Pulse Survey is one important tool that will help the Center assess COVID-19’s impact on the nation’s households as the crisis evolves.


