We often release data tables with our major reports, working papers, interactive charts, and other publications. This page lists recent content that has data associated with it.
To access the data, click the "View Data" button; to access the publication associated with the data, click the title/headline. You can also use keywords to refine the list, or search to explore all data. For assistance, contact [email protected].
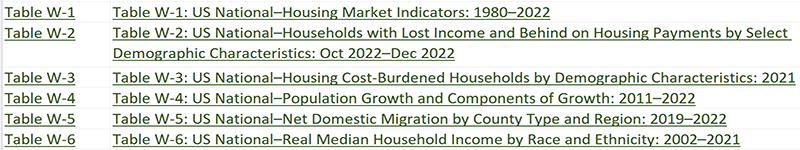
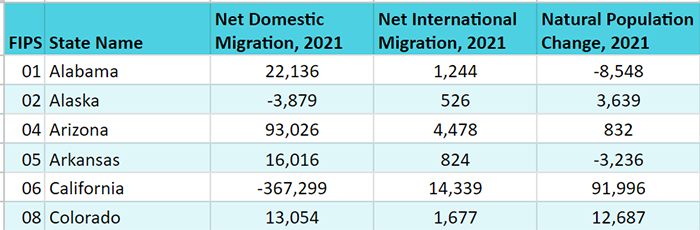
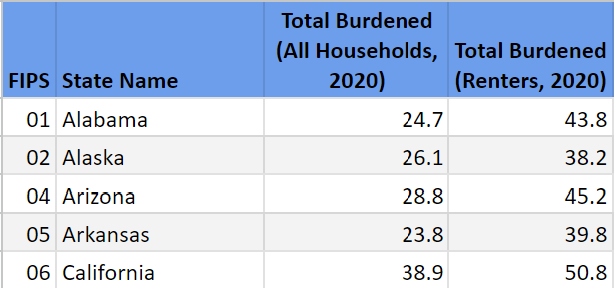
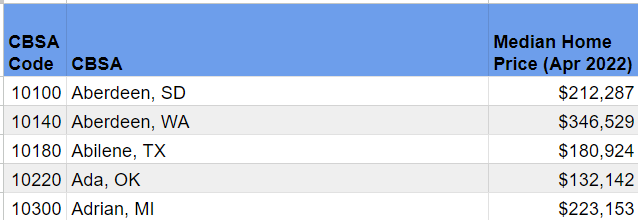
US housing markets continue to cool as higher costs weigh on both homeowners and renters. On the for-sale side, home sales and construction levels have declined while rental markets are...
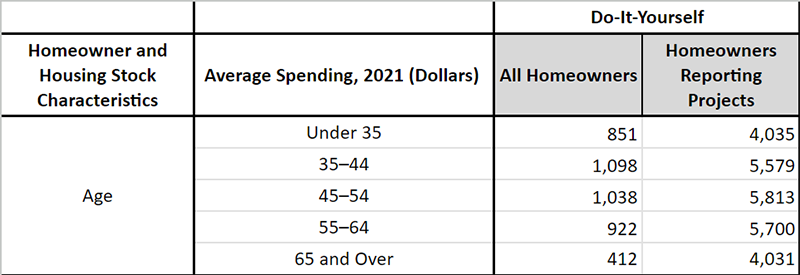
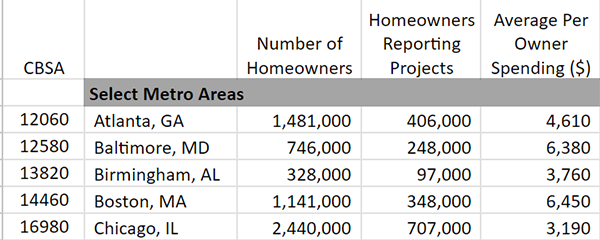
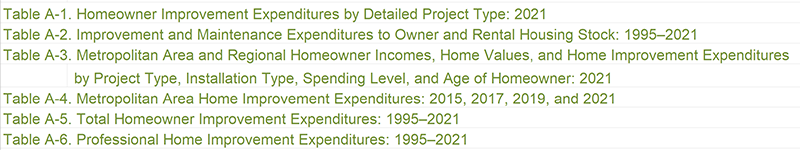
Sparked by pandemic-induced changes in household routines and use of living space, home improvement and repair spending soared to new heights in 2022, reaching an estimated $567 billion...