The Surge in Household Growth and What It Suggests About the Future of Housing Demand

As rising interest rates cooled demand for housing in 2022, new data on household growth is helping provide a better picture of just how hot demand had been between 2019 and 2021.
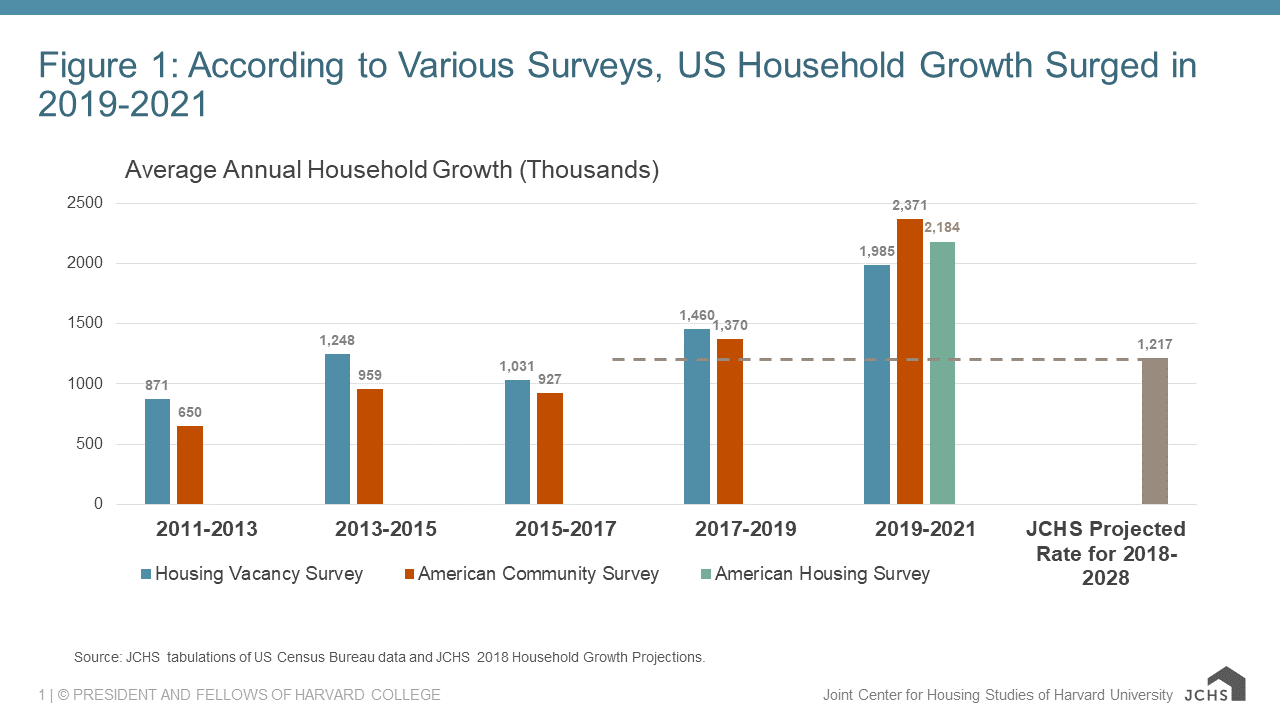
Three household surveys released over the past few months by the Census Bureau all show nearly unprecedented levels of household growth from 2019 through 2021. The American Community Survey (ACS), Housing Vacancy Survey (CPS/HVS), and American Housing Survey (AHS) each report that annual household growth between 2019 and 2021 averaged between 2.0 million and 2.4 million per year (Figure 1). This level of household growth is well above the 1.4-1.5 million per year pace averaged in 2017-2019, prior to the pandemic, which itself was already higher than previous levels or the 1.2 million households per year average baseline growth rate for 2018-2028 that we projected in 2018.
Figure 1: According to Various Surveys, US Household Growth Surged in 2019-2021
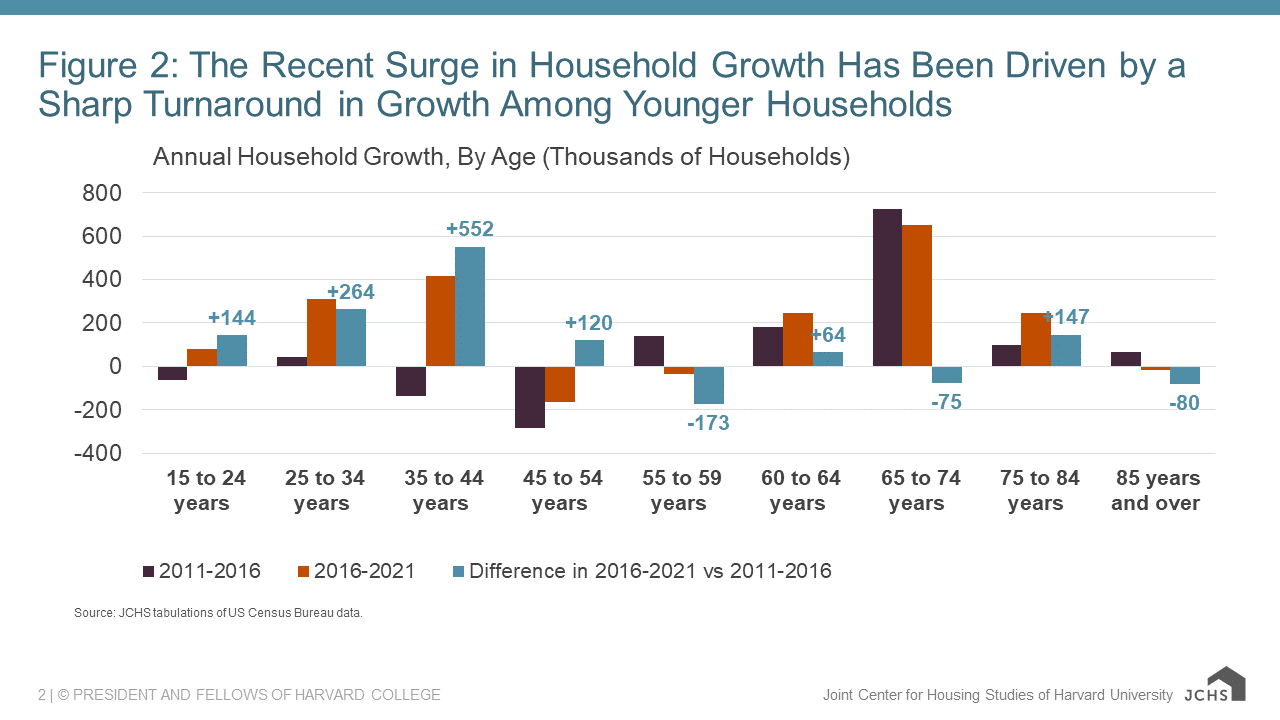
Much of the acceleration in household growth was driven by a pickup in growth among millennials, continuing a longer-term trend that has been building since 2016. Indeed, while the number of older adult households has been growing significantly and steadily over the past ten years, the biggest changes in household growth over the past five years have been among adults under age 45 (Figure 2). The number of households headed by 25-34 year-olds grew by 300,000 per year in 2016-2021, up sharply from average annual growth of 45,000 households between 2011-2016, a difference of 260,000 additional households per year. The number of households headed by adults aged 35-44 grew even more rapidly, by fully 400,000 per year in 2016-2021 after having declined by an average of 150,000 per year in 2011-2016, which was a swing of 550,000 households per year in overall household growth among this age group. Such a pickup in growth in this age group cannot be explained by growth in the underlying population alone, and suggests older millennials were now forming the households that had been delayed earlier in the decade.
Various economic factors in 2020 and 2021 enabled many people - largely millennials - to form and head new households when they had not been able to do so for years previously. Wages were up 4.9 percent in 2021 as the unemployment rate dropped from 6.7 percent in December 2020 to 3.9 percent in December of 2021. Three rounds of stimulus payments helped adults grow savings for deposits or downpayments, and the pause in student loan payments left borrowers an average of $200 per month to spend on other items. These factors seem to have enabled the release of years of pent-up demand for new households.
Figure 2: The Recent Surge in Household Growth Has Been Driven by a Sharp Turnaround in Growth Among Younger Households
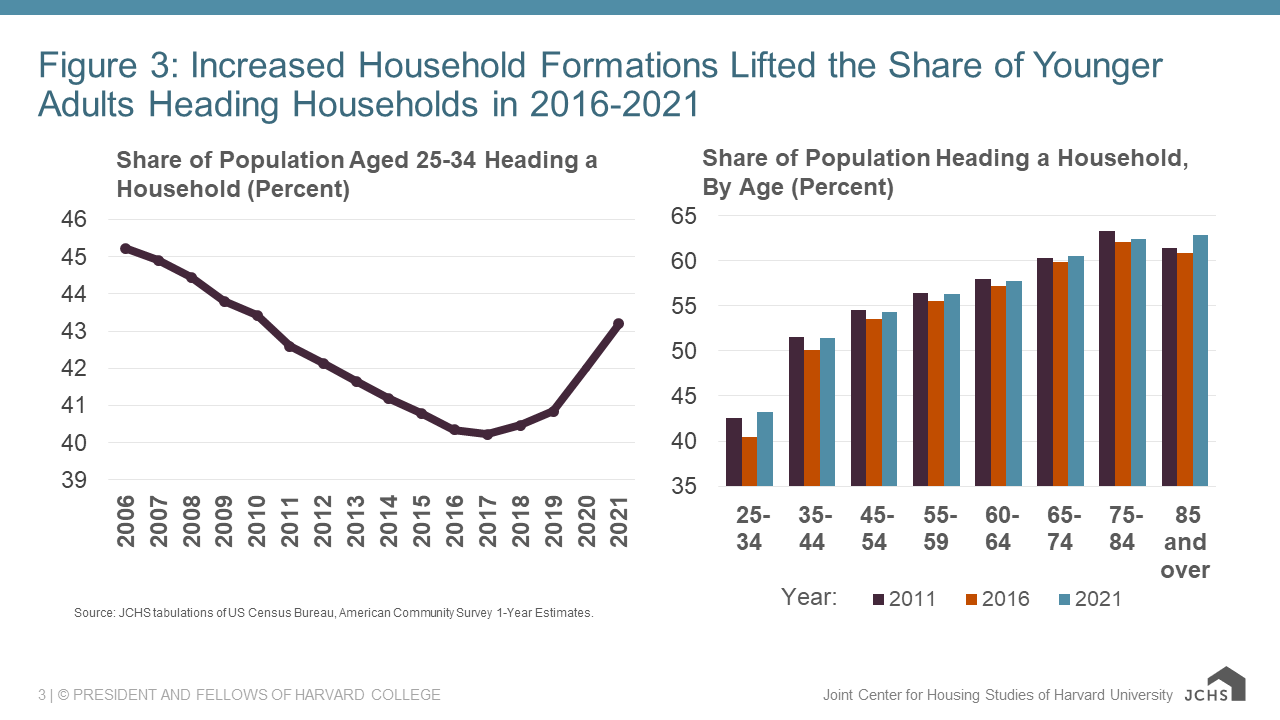
Indeed, household growth can be generated either by growth in the size of the adult population or growth in the share of the population heading an independent household– or both. The surge in household growth among millennials appears to have been driven by sharp growth in the share of the population heading their own household – also known as the headship rate (Figure 3). Headship rates were up across age groups, but rose most among those aged 25-34 and 35-44—ages that had the largest declines earlier in the decade. As a result, by 2021 headship rates for most age groups had recovered nearly all ground lost during the Great Recession and were back to levels from 2011.
Figure 3: Increased Household Formations Lifted the Share of Younger Adults Heading Households in 2016-2021
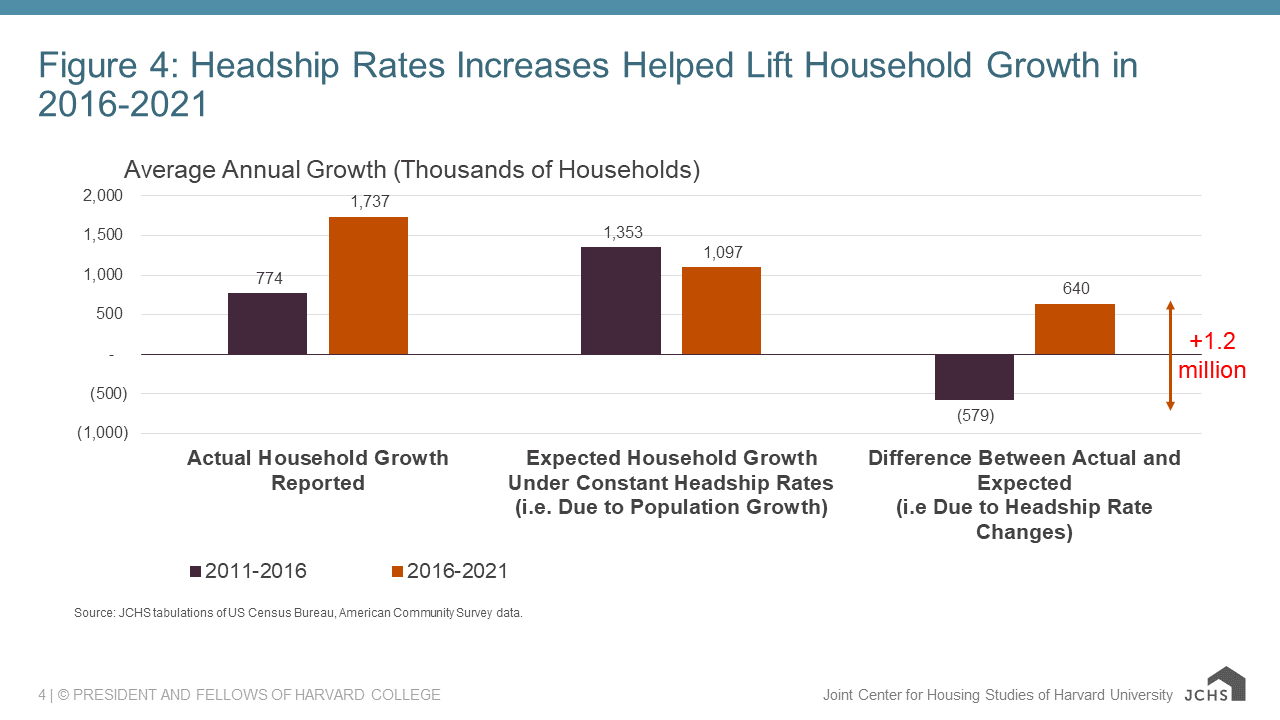
As such, the widespread rise in the share of people heading households between 2016-2021 provided an extra boost to household growth that came on top of that expected from growth in the underlying adult population during that time. Our calculations suggest that the rising headship rates were responsible for about 640,000 of the 1.7 million average annual household growth during that period (Figure 4). This came in sharp contrast to 2011-2016, when falling headship rates dragged down household growth by about 579,000 per year below the average levels that population growth alone would have generated. The reversal in the role of headship rates from being a headwind to household growth in 2011-2016 to a tailwind in 2016-2021 led to a significant surge in household growth, equivalent to a swing of 1.2 million additional households per year.
Figure 4: Headship Rates Increases Helped Lift Household Growth in 2016-2021
That so much of the recent acceleration in household growth was dependent on headship rate changes, rather than population growth, explains how we could have such a high level of household growth at a time when population growth in the US was hitting hit record lows. In fact, in each of the years 2019, 2020, and 2021, the Census Bureau reported new 100-year lows in population growth.
However, its dependence on headship rate increases also suggests the current surge in household growth is temporary. Headship rates for most age groups have recovered to rates from a decade ago, and with deteriorating affordability for both renters and homeowners over the past year, further gains in household formation may be limited. Additionally, looking back over the decades, headship rate changes have historically had a net negative effect on household growth anyway, lowering it by an average of 200,000 per year since 1990, which further suggests the current period of rising headship rates may be an aberration and not a lasting trend.
With additional increases in headship rates unlikely, population growth will retake its historical role as the main driver of household growth. But population growth has slowed to a near standstill, and it remains unclear when and if it will fully recover. So, although we haven’t felt it yet because of the jump in headship rates and the fact that some of the decline in population growth has been fewer births (which don’t affect household growth), the record low population growth levels will soon be reflected in lower levels of household growth. And these lower levels could be around for a while.
Over the long term, less population growth could also mean future household growth will continue to depend more on driving factors that are less stable and predictable, such as immigration and headship rates and the factors that support them, including changes in incomes and housing affordability. Given that household growth is the largest source of new housing demand, the impact on markets could be significant.


