
Moving During the Pandemic: Mass Exodus or Mass Inertia?
Despite an early surge in moves when the COVID-19 pandemic began, a shrinking share of Americans moved over the past two years, a pattern consistent with declines in mobility rates that predate the pandemic. However, as I document in “Did More People Move During the Pandemic?”, a new research brief, a growing share of those who did move ended up in suburbs, smaller metros, and rural areas.
As I noted in an earlier research brief, residential mobility rates have been declining for the past four decades. The declines happened across the board but were steepest among young adults and renters, and for local moves. In the new brief, I build on that work and draw on a variety of data sources to explore how moving has changed during the pandemic. One finding was that the types of moves and movers that had the steepest mobility rate declines before the pandemic remained the same during the pandemic. From 2019 to 2021, the mobility rate for adults aged 18–24 fell from 24.1 to 23.1 percent, while mobility rates among renters fell from 23.2 to 20.8 percent, according to American Community Survey (ACS) data. Local (within-state) moves, which are by far the most common type of move, fell from 10.2 to 9.3 percent. Interstate migration rates, in contrast, stayed steady at just over 2 percent.
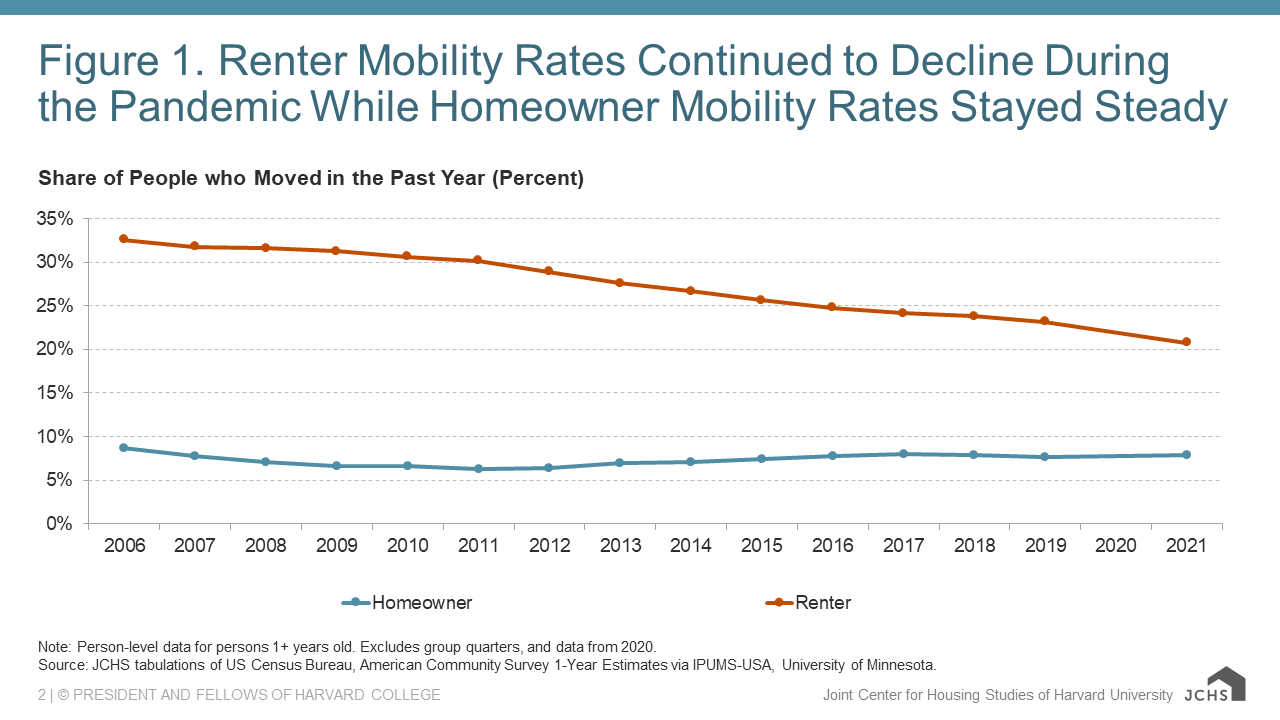
Overall mobility rates declined across demographic characteristics including age, race, and ethnicity. There were notable exceptions among better-resourced groups, however, implying that those who were more able to move during the pandemic bucked the ongoing decline in mobility rates to do so. For example, the mobility rate for adults with a four-year college degree held steady from 2019 to 2021, and the rate for people in the highest-income quartile households actually rose slightly. Likewise, the homeowner mobility rate inched up in 2021 while the renter mobility rate continued to fall (Figure 1). This could be a reflection of both increased homebuying during a time of record-low interest rates and the record-high lease renewal rate by renters who were responding to high rents on the open market.
Figure 1. Renter Mobility Rates Continued to Decline During the Pandemic While Homeowner Mobility Rates Stayed Steady
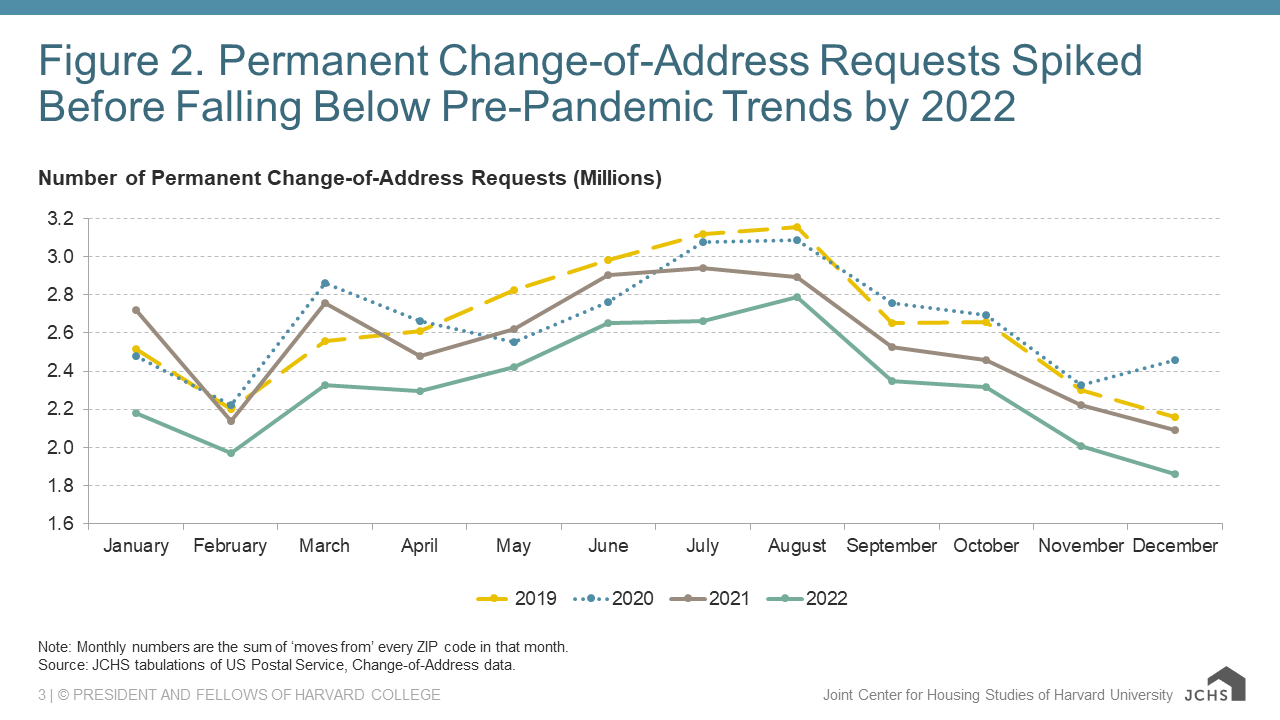
Annual data, however, miss the nuance that monthly data are better able to capture. Fortunately, the United States Postal Service (USPS) Change of Address (CoA) data offer insight into monthly trends in mobility throughout the pandemic. These data reveal that moves spiked twice early in the pandemic before reverting to pre-pandemic levels by the end of 2021 and falling further throughout 2022 (Figure 2). As a result, USPS data show all types of moves—individual, family, permanent, and temporary—were lower in 2022 than before the pandemic. It is worth noting that, while the initial spike in mobility and the second increase in late 2020 and early 2021 coincide with the onset of the pandemic and the first major surge in COVID-19 cases, there were no mobility spikes during later surges like those associated with the Delta and Omicron variants.
Figure 2. Permanent Change-of-Address Requests Spiked Before Falling Below Pre-Pandemic Trends by 2022
Although fewer people moved during the pandemic, there were significant shifts in where people moved. Perhaps most notably, rural counties attracted more migrants than usual, as I illustrated with maps in an earlier blog post. The share of non-metropolitan counties with net inflows shifted from a minority to nearly two-thirds of these counties from 2019 to 2021, according to Population Estimates Program data (Figure 3). Counties in small or medium metro areas (fewer than 1 million people) also attracted more movers than usual, with the net inflow share growing from 55 to 70 percent. Additionally, the pre-pandemic trend away from large urban counties and towards suburban counties appeared to accelerate during the pandemic. Just one-quarter of central urban counties in large metro areas had net inflows in 2019, which fell to 15 percent in 2021. In contrast, the share of counties on the fringe of large metro areas with net inflows grew from 70 to 80 percent.
Figure 3. Movers Focused on Suburbs, Smaller Metros, and Rural Counties During the Pandemic
| County Type | Net Inflow, 2019 | Net Inflow, 2021 | Total Counties | Net Inflow Share, 2019 | Net Inflow Share, 2021 |
|---|---|---|---|---|---|
| Large Central Metro | 16 | 10 | 68 | 24% | 15% |
| Large Fringe Metro | 259 | 295 | 368 | 70% | 80% |
| Small or Medium Metro | 401 | 511 | 730 | 55% | 70% |
| Micropolitan or Non-Metropolitan | 772 | 1,246 | 1,975 | 39% | 63% |
The research brief provides more detail on these trends and also contains analysis of state-level migration flows, and how the reasons people moved changed during the pandemic. The paradigm-shifting nature of the pandemic makes it difficult to assess whether and how mobility patterns will change in coming years, but there are many factors pointing to a continued decline in mobility rates. The effects of new work and home arrangements on residential mobility, however, may also take years to fully materialize.