
Mind the Gap: The Importance of Over and Under Counts in Interpreting Decennial Census Results
Every ten years the Decennial Census provides a definitive count of the country’s population and households, a critical benchmark of decadal growth trends in these key measures. However, often overlooked in assessments of these trends is that after each census, the Census Bureau conducts a post-enumeration evaluation that provides an estimate of the likely error rate in the Decennial Census counts. When calculating decadal population or household growth using decennial censuses, failure to adjust for differential undercount/overcount between censuses can lead to spurious results. This is especially true when calculating growth between 2000 and 2010 and comparing it to growth between 1990 and 2000, because the magnitude and direction of the estimated errors have varied substantially over these three counts. Taking undercount/overcount estimates into account, growth in both population and households over the last decade was slightly higher than during the 1990s, even though the unadjusted numbers suggest a fairly substantial slowdown in growth.
In the spring the Census Bureau released initial findings from the Post-Enumeration Survey indicating that the 2010 Decennial Census hit the center of the bull’s eye on a true population count. The Bureau estimated that the 2010 Census overcounted total population by a mere 0.01 percent (1 one hundredth of one percent). This amounts to only 35,000 people, which is not statistically significant from zero. In contrast, the Bureau estimated that the 2000 Census overcounted population by 0.49 percent, or 1.37 million persons. The difference in overcount between the two censuses means that population growth from 2000 to 2010 was actually 1.34 million larger than calculated by unadjusted population counts due to the difference in the estimated overcounts in each year. This estimate is for the overall population, so there are likely some groups (broken down by age or race/Hispanic origin, for example) with relatively greater growth adjustments necessary.
For 2010 the Bureau stated that there was also no significant overcount/undercount of occupied housing units (households). The initial (March 2001) post-enumeration evaluation following the 2000 Census had to be re-done and the final report (March 2003) did not include an estimate of the overcount/undercount for households. But if we assume that households suffered from the same 0.49 percent overcount as population in 2000, then we need to add an additional 500,000 households to the 11.2 million growth calculated for 2000 to 2010 from the unadjusted numbers. At 11.7 million, the 2000 to 2010 census-to-census household growth is actually fairly close to the decadal growth of 12.2 million from estimates derived from the Current Population Survey (based on a rolling 3-year average of households to dampen sampling variation in these estimates).
By adjusting for overcount/undercount, not only was population (and probably household) growth over the past decade greater than results from unadjusted raw census numbers, but also the slowdown in growth from the previous decade’s level was non-existent. This is because actual growth between 1990 and 2000, adjusting for overcount/undercount, is significantly reduced. Unadjusted population growth between 1990 and 2000 was 32.2 million, while adjusted growth was substantially less at 26.7 million. Unadjusted population growth from 2000 to 2010 was 26.4 million, and the adjusted figure is 27.7 million. So instead of a slowdown in total population growth in the 2000s compared to the 1990s, adjusted figures show a slight increase in population growth (Table 1). And if household counts were off by the same percentage as the population estimates, household growth between 2000 and 2010 also exceeded growth in the previous decade.
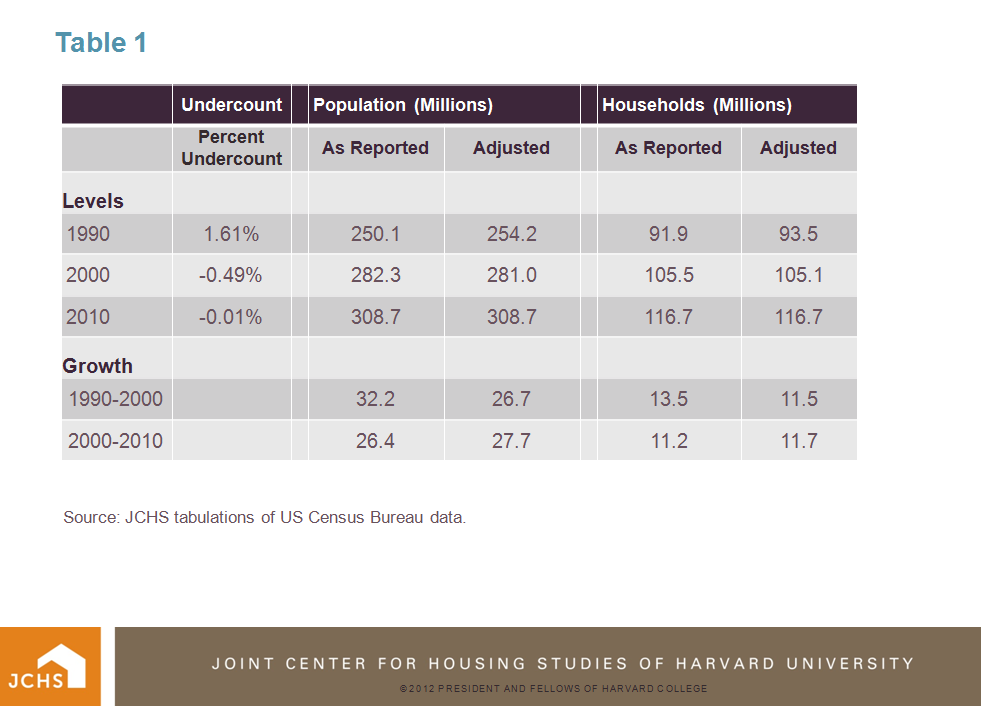
Source: JCHS tabulations of US Census Bureau data
The 11.7 million adjusted household growth estimate for 2000 to 2010 is larger than the 11.5 million adjusted growth number for 1990 to 2000. Still, growth in the 2000s is well short of the expected household growth due to the impacts of the Great Recession. Household growth fell off sharply after 2007 because of the huge upheaval in both housing markets and the broader economy, with its attendant hit to household formation rates of those under the age of 35 and a dramatic slowdown in immigration. Together, these forces more than offset the expected increase of household formation by echo boomers who began to turn age 20 in 2005.
Most of the postponed echo boom household formation will be realized in the near-term future as these young adults inevitably form households and so is not permanently lost. But overall household growth also depends on future levels of immigration, which remains the biggest wildcard. Immigration flows are very much dependent on future economic trends, both here and in sending countries, as well as on how much future immigration is enabled in a highly uncertain political climate.