Home Price-to-Income Ratio Reaches Record High
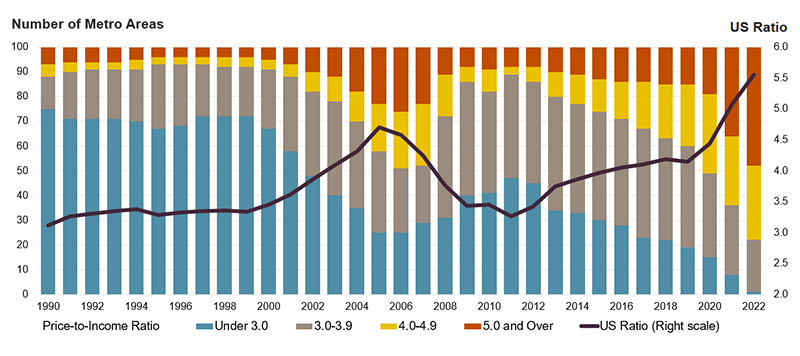
In 2022, the median sale price for a single-family home in the US was 5.6 times higher than the median household income, higher than at any point on record dating back to the early 1970s. This represents a rapid increase in just a few years, as home prices have risen considerably since the start of the COVID-19 pandemic. As recently as 2019, the national price-to-income ratio was just 4.1. High price-to-income ratios are an especially worrying indicator of deteriorating homebuyer affordability. Record-low mortgage rates during the pandemic cushioned the impact of higher home prices by keeping mortgage payments relatively modest, but interest rates rose significantly throughout 2022 and have remained elevated since. The interactive chart below shows the variation in price-to-income ratios in metro areas across the country and how they’ve changed over time (Figure 1).
Figure 1: From 1980-2022, Home Price-to-Income Ratios Rose to All-Time Highs in Many Metros
As the interactive shows, home prices have soared relative to incomes in a growing number of metro areas. Indeed, among the 100 largest markets in the country, 48 had a price-to-income ratio exceeding 5.0 in 2022, including seven markets with a price-to-income ratio above 8.0. By comparison, 15 markets had price-to-income ratios above 5.0 as recently as 2019 and just five markets had ratios that high in 2000 (Figure 2). With the rapid rise in prices since the beginning of the pandemic, price-to-income ratios have reached all-time highs in 78 of the nation’s 100 largest markets. Only Syracuse had a price-to-income ratio under 3.0 among large markets in 2022. Price-to-income ratios that low were the norm across much of the country in prior decades. Indeed, fully two-thirds of large markets had price-to-income ratios below 3.0 as recently as 2000.
Figure 2: Home Price-to-Income Ratios Continued to Rise Nationally and in Many Large Metros in 2022
Notes: Price-to-income ratios are for the 100 largest metro areas by population. Home prices are the median sale price of existing single-family homes and incomes are the median household income within markets. Income data for 2022 are based on Moody’s Analytics forecasts. Source: JCHS tabulations of NAR, Metropolitan Median Area Prices; Moody’s Analytics estimates.
Even with the widespread increase in home prices relative to incomes, price-to-income ratios still varied considerably in 2022. The highest price-to-income ratios were largely on the West Coast, including Honolulu (12.1), San Jose (12.0), and San Francisco (11.3). Outside the West Census Region, the highest price-to-income ratios were along the East Coast in markets with severe and persistent affordability challenges, including Miami (8.7), New York (7.1), and Boston (6.5). Even in more traditionally affordable markets, sale prices climbed to more than four times the median household income. In the Midwest, for example, price-to-income ratios were highest in Madison (5.0), Milwaukee (4.9), and Chicago (4.3). Price-to-income ratios were lowest, but still rising, in many of the Northeast and Midwest markets typically associated with the Rust Belt.
The rise in home prices plays a central role in the growth of price-to-income ratios as incomes simply do not increase at the same rate. Nationally, home prices grew by 43 percent between 2019 and 2022, while incomes grew by just seven percent in that same period. Median home prices have grown the most between 2019 and 2022 in Boise and North Port, FL (67 percent), Austin and Cape Coral (66 percent), and Phoenix (65 percent). However, in those same markets, median incomes have only grown between 7 and 15 percent. Indeed, these metros recorded some of the fastest price-to-income ratio increases since the beginning of the pandemic. Further, while median incomes varied from about $45,000 in McAllen, TX to $146,000 in San Jose—a 3x difference—the median sales price ranged from $141,000 to $1.8 million in those same markets—a far more substantial 13x difference.
Historically low interest rates during the pandemic helped enable the steep rise in price-to-income ratios, as low mortgage rates enabled homebuyers (with the means to cover a downpayment) to bid up home prices and keep their mortgage payments relatively low. But with rising interest rates in 2023 leading to deteriorating affordability, will price-to-income ratios continue to rise? The slowdown in home price growth nationally suggests that rising price-to-income ratios will at least slow, if not decline modestly. However, widespread inventory shortages and persistent demand for housing will likely keep home prices (and price-to-income ratios) historically high, an indication of the growing and persistent unaffordability potential homebuyers face.


