With Existing Inventories Historically Low, Homebuyers Turn to the New Home Market

Despite the cooling housing market, inventories of existing homes for sale have barely budged from all-time lows experienced during the pandemic. As a result, homebuyers have increasingly turned to the new home market which comprises a higher share of available inventory. Meanwhile, in an attempt to alleviate growing affordability pressures on buyers due to increased interest rates, homebuilders are offering incentives to buyers in the form of interest rate buydowns. These two factors have combined to markedly increase the attractiveness of the new home market for many buyers.
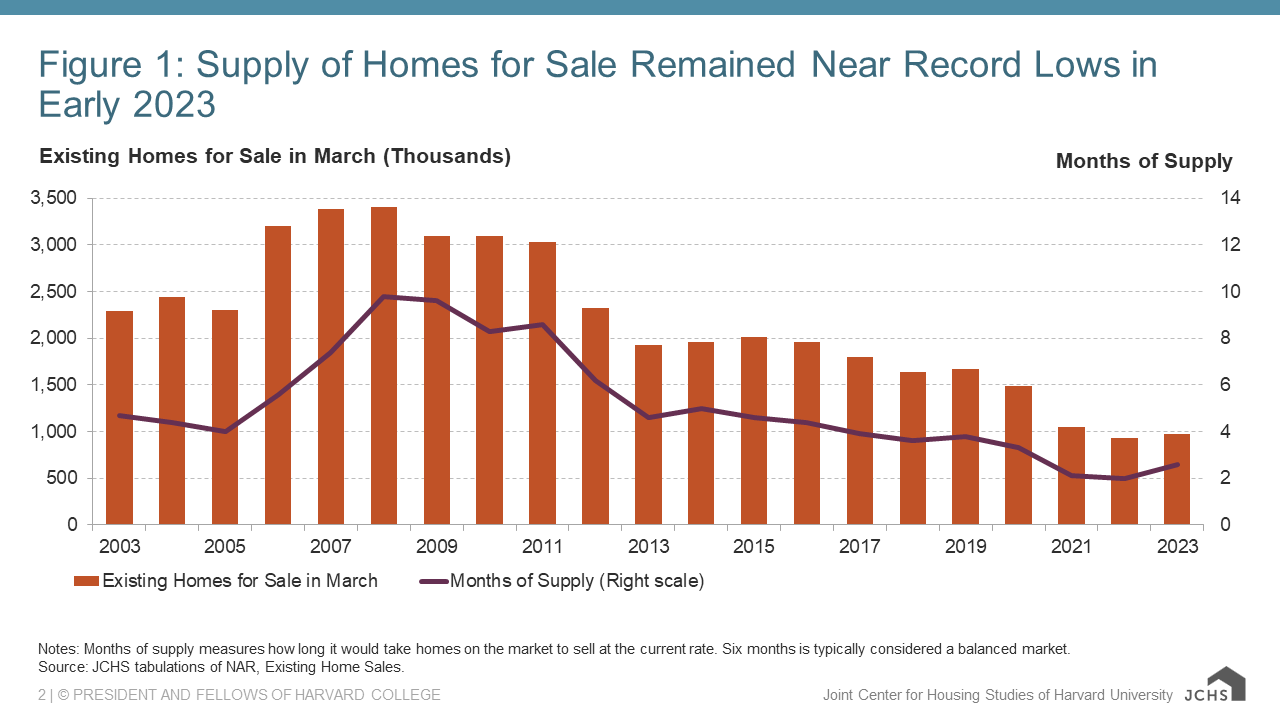
According to the recently released State of the Nation’s Housing 2023, the number of existing homes available for purchase today remains near the record lows set in early 2022. Indeed, there were just 970,000 existing homes on the market in March 2023, up 4 percent from the year before but down 42 percent from the same month in 2019—a period when inventories were already historically low (Figure 1). In terms of the months of supply—the amount of time it would take to sell all homes on the market at the current sales rate—inventories have risen only slightly more, ticking up to 2.6 months of supply in March, up from 2.0 months in 2022 but still below the 3.8 months posted in 2019. Existing inventories have remained low even through the second quarter of this year, a time when homebuying usually peaks.
Figure 1: Supply of Homes for Sale Remained Near Record Lows in Early 2023
These inventory shortages are pervasive across the country. According to Center tabulations of data from Realtor.com, active inventories (which exclude pending sales) rose in 68 of the nation’s 100 largest markets between the second quarter of 2022 and the second quarter of 2023 (Figure 2). However, relative to 2019, inventories were still down in 99 markets, or every large market in the country outside of Austin. Indeed, relative to 2019, active inventories were down more than 50 percent in about half (51) of large metro areas, and down 30 to 50 percent in an additional two-fifths (37) of markets between 2019 and 2023.
Figure 2: Despite Recent Increases in Most Metro Areas, Inventories Are Still Far Short of Their Pre-Pandemic Levels in Nearly Every Market
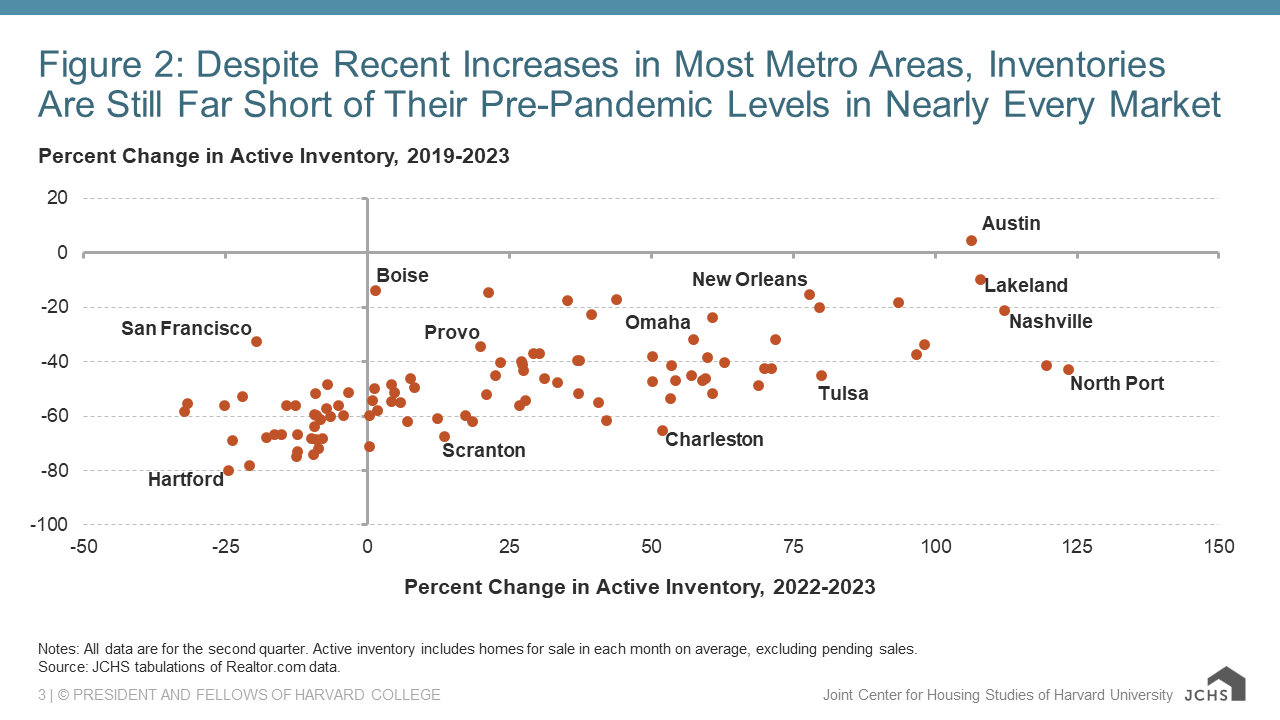
While supply constraints are pervasive, inventories declined most in relatively small markets in the Northeast. Hartford had an average of just 400 homes on the market in the second quarter of 2023, for example, down from the 4,400 homes available in the same quarter in 2019—a whopping 80 percent decline. Inventories were also down 78 percent in Bridgeport, 73 percent in Albany, and 72 percent in Providence. Active for-sale inventories were also down by more than half in large markets as diverse as Baltimore (68 percent), Chicago (66 percent), Cleveland (60 percent), Los Angeles (57 percent), Atlanta (56 percent), and San Jose (55 percent). Supply has remained constrained even in hot markets that experienced more substantial inventory growth over the past year. Indeed, active inventories rose 108 percent year over year in Lakeland, FL in the second quarter, but were still down 10 percent from the same period in 2019. Likewise, inventories were still down 17 percent in Ogden, UT; 21 percent in Nashville; and 23 percent in Las Vegas despite inventories rising more recently.
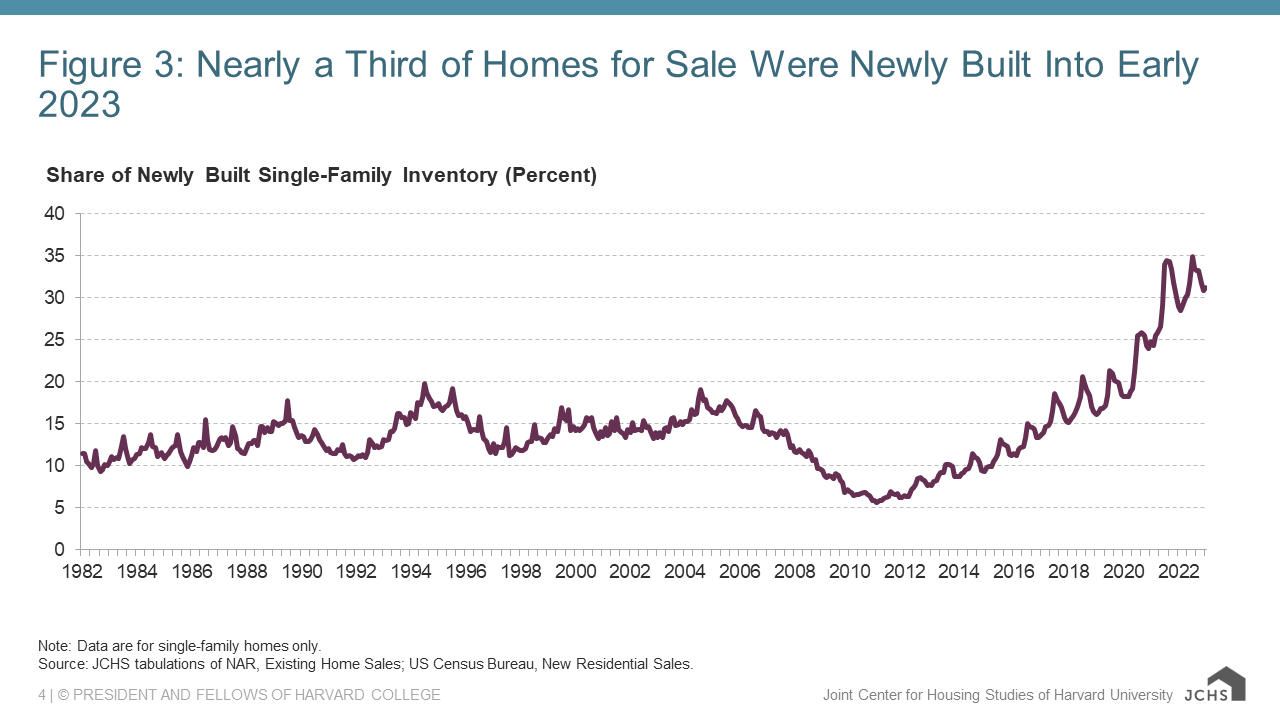
Such persistently tight existing inventories, along with increasing supplies of new home inventories, have made newly-built homes a growing share of the available market. Since the end of 2021 and through early 2023, nearly one-third of single-family homes available for sale have been newly built, holding at a four-decade high and up from about 14 percent of inventory on average historically (Figure 3). At the same time, to attract buyers, homebuilders have increasingly offered incentives less available in the existing home market. These incentives typically take the form of rate buydowns, where the builder pays more up front to enable a lower mortgage rate over a specified period of time, usually when a buyer finances the home purchase through a partnering lender. Rate buydowns lower monthly payments on a mortgage and are intended to mitigate the declining affordability that has come with rising rates. For example, DR Horton, the nation’s largest homebuilder, markets its 2/1 Buydown Program with an interest rate that varies from about 3-5 percent on a 30-year fixed rate mortgage. They’re not alone – according to the most recent Home Builder Survey from John Burns Real Estate Consulting, 30 percent of homebuilders nationally reported increased use of interest rate buydowns in the second quarter of 2023, while an additional 38 percent reported similar use as in the past quarter. By comparison just 15 percent of builders reported a decrease in interest rate buydowns and 18 percent reported not offering any rate buydowns.
Figure 3: Nearly a Third of Homes for Sale Were Newly Built Into Early 2023
Use of these interest rate incentives and the dearth of competition from existing sellers are two reasons homebuilders remain optimistic, despite ongoing affordability challenges and persistently higher mortgage rates. Through August, the National Association of Home Builders’ Housing Market Index remained above the recent lows experienced at the end of 2022. Single-family housing starts have also strengthened in the summer months. In any case, more homebuilding is needed not only in the short term to provide potential homebuyers with more options, but an increase in construction is also crucial to address the widespread supply shortages that have contributed to the unprecedented rise in home prices over the past few years.
Note: An earlier version of this blog incorrectly labeled the ratio of existing home inventory to new home inventory. It has been corrected to include the correct share of single-family inventory that is newly built.


