
Behind the Data: The Demographics of Slow-Growing Areas
The modest population growth in many slow-growing US states not only masks significant racial and ethnic changes among residents, it also obscures significant changes in the demographics of children, working-age adults, and older adults.
As I noted in a previous blog post, eight slow-growing states, mainly in the Northeast and Midwest (New York, New Jersey, Pennsylvania, Massachusetts, Ohio, Illinois, Michigan, and Maryland), had particularly high levels of domestic out-migration and foreign in-migration between 2010 and 2018. Moreover, in six of these slow-growth, high-turnover states, the minority population increased significantly between 2010 and 2017 (Table 1).
Table 1
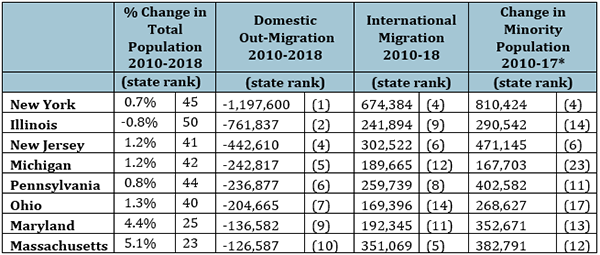
Source: Census Bureau annual population estimates *State estimates by race/Hispanic origin available through 2017
The Census Bureau’s data, which include estimates by age, also show significant changes in the racial and ethnic makeup of adults and children in these states. For example, consider changes just among prime working-age adults (those 18 to 54). In all eight slow-growing, high-turnover states, the number of non-Hispanic whites in this age group fell significantly. And although the number of minorities grew in these states, the growth was not sufficient to offset the decline in non-Hispanic white, working-age adults (Figure 1).
In fact, while my earlier post noted that the total non-Hispanic white population fell in roughly a third of states, the population of non-Hispanic white, working-age adults fell in 44 states. This suggests that the drop was not entirely driven by domestic out-migration, but in part because the large baby boom generation has aged beyond prime working years (the youngest boomers are turning 55 in 2019).
Figure 1. Change in the Size of the Prime Working Age Population 2010-2017 By Minority Status
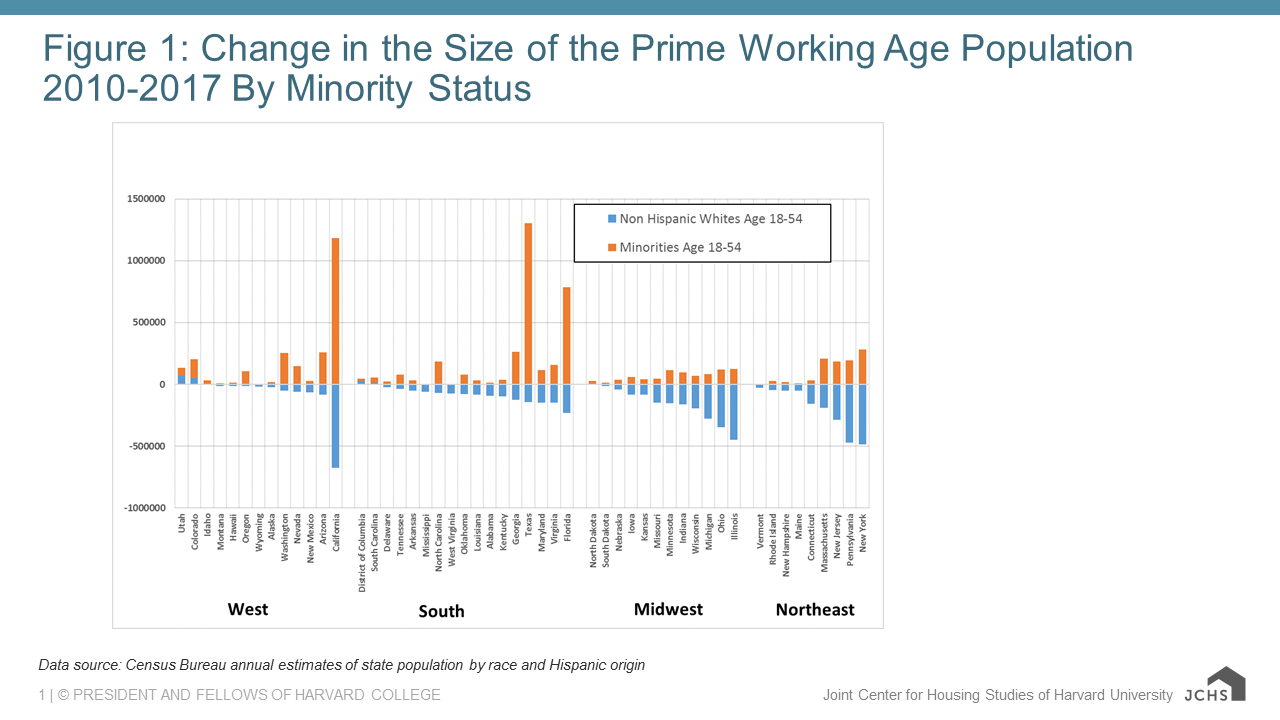
Source: Census Bureau annual estimates of state population by age, race, and Hispanic origin
At the same time, the fact that a higher share of millennials are minorities means that the number and share of minority working-age adults will continue to increase. In fact, unless state-specific domestic migration and immigration levels change markedly during the next decade, minority growth should begin to fully offset non-Hispanic white losses among the working-age populations in the slow growing, high-turnover states.
These demographic changes were equally dramatic among school-aged children (those 5 to 17). While the number of minority children rose in all but a handful of states, the number of non-Hispanic white children fell in all but nine states. Overall, in about half of all states, the declines for non-Hispanic white school-aged children exceeded the increases in minority children, or both declined. In contrast, minority school-aged population growth fully offset declines among non-Hispanic white children in about a quarter of states (Figure 2).
The declines in non-Hispanic white school-aged children were especially large in the slow-growing, high-turnover Northeastern and Midwestern states, as well as in California. In both Michigan and Illinois, the population of both white and minority children declined. In the other six slow-growing, high-turnover states, the decline in white children far exceeded the gain in minority children.
Figure 2. Change in the Size of the School Age Population 2010-2017 By Minority Status
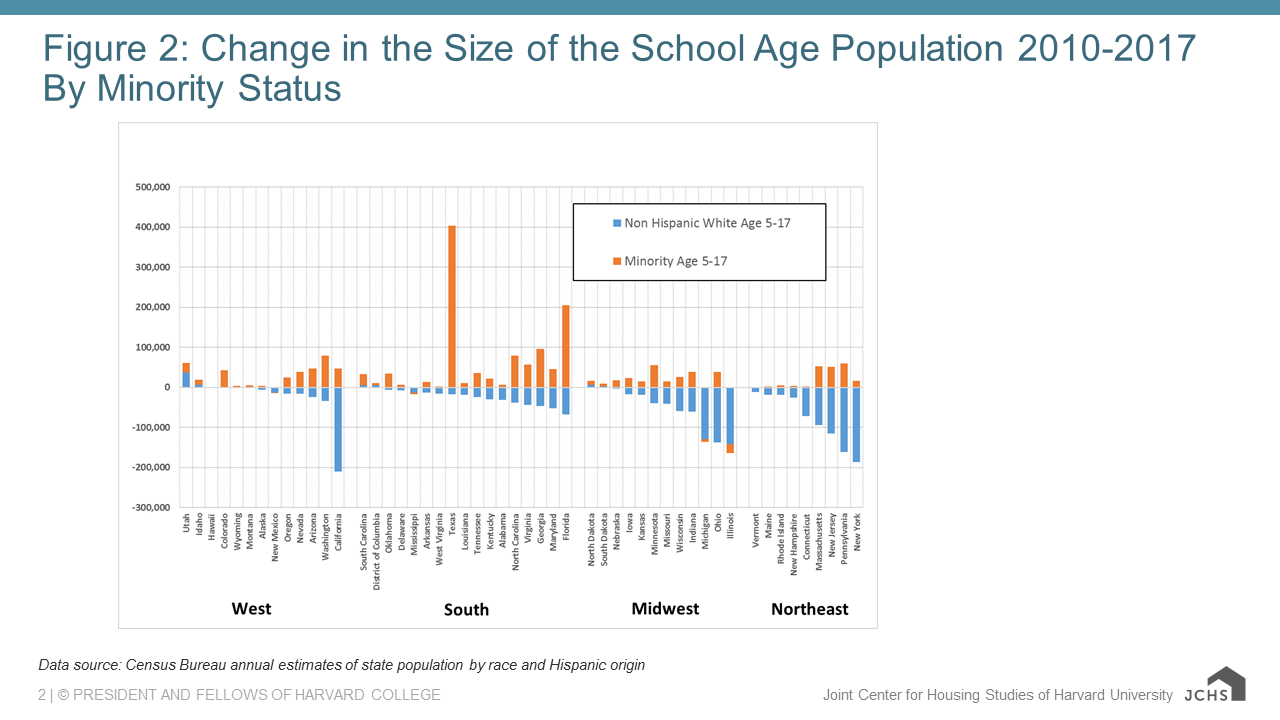
Source: Census Bureau annual estimates of state population by age, race, and Hispanic origin
Very different patterns are occurring at the other end of the age spectrum, among those 55 and older. Between 2010 and 2017, the number of people in this age group increased in all 50 states, including the eight slow-growth, high-turnover states. The majority of the gain in five of these eight states is due to growth of the non-Hispanic white population, which is consistent with the fact that in most states the majority of aging baby boomers are non-Hispanic whites. The exceptions were New York, Massachusetts, and Illinois, which, along with Florida, California and Texas, were among the handful of states where the growth in the population of older minorities exceeded the growth in non-Hispanic whites (Figure 3).
Figure 3. Age 55+ Population Growth by Minority Status is Broadly Similar Across States: 2010-2017
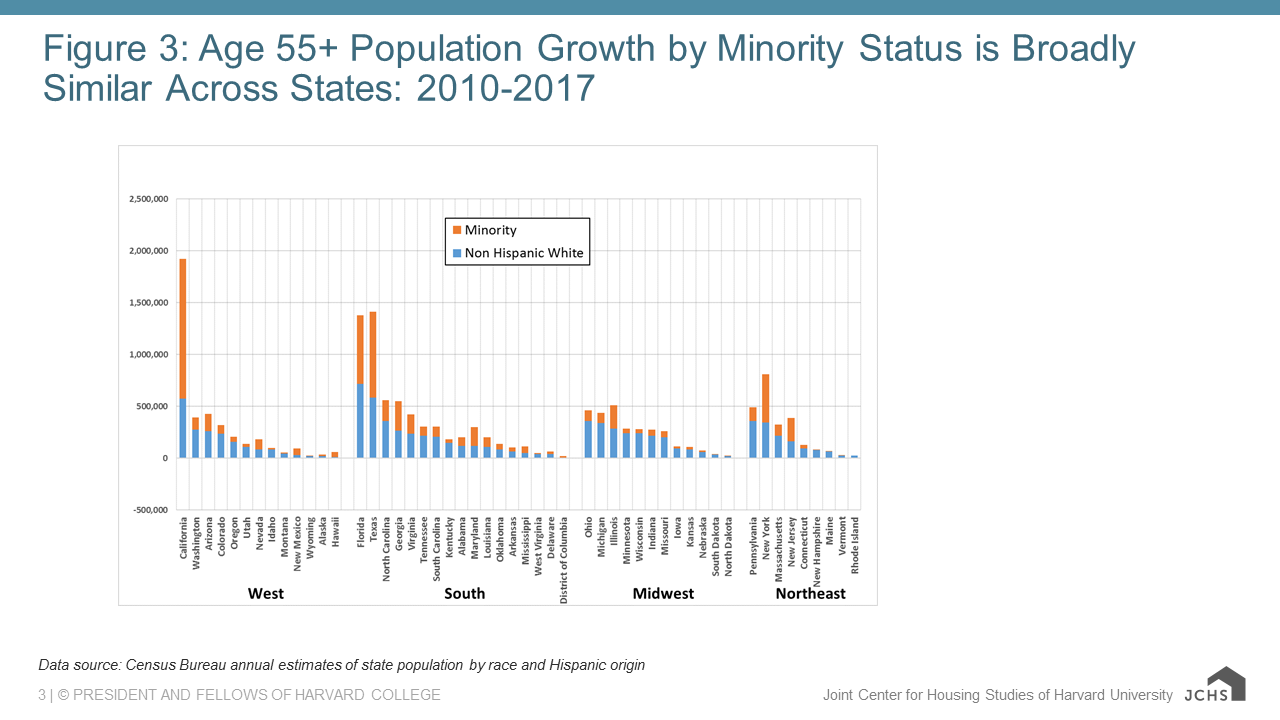
Source: Census Bureau annual estimates of state population by age, race, and Hispanic origin
These changes all have important implications for state and local housing policies. For example, both fast- and slow-growth states will need to address the housing consequences that will result from an increasingly older population, particularly if people want to age in place. In contrast, places with declining school-age populations could have difficulty keeping schools open, which could negatively impact housing prices and increase vacancy rates because neighborhoods that have lost their schools often become less attractive to young families. The changes in the working-age population underscore the fact that new migrants to slow-growing states, regardless of their race, ethnicity, or nativity, will play increasingly important roles in maintaining healthy economies and sustaining viable housing markets.