
Are Cost Burdens High in Small, University-Dominated Metros?
On the surface at least, housing affordability is a major issue in the markets dominated by large public universities. In 2017, 49 percent of renters in the Ann Arbor metro area paid more than 30 percent of their incomes for housing, the standard measure for housing cost burdens. As a result, Ann Arbor—home to the University of Michigan and over 44,000 undergraduate and graduate students—had the third-highest cost-burden rate of the state’s 14 metros, just behind Flint and Jackson, markets where median incomes were much lower.
There are many reasons for this. Colleges, particularly large research universities, can be significant drivers of economic growth, attracting not only high-skilled employees but also a host of firms who in turn employ their own high-skilled workforce. The presence of these workers, and large numbers of students living in off-campus housing, can drive up rents.
Indeed, many students struggle to pay for housing. Food insecurity and homelessness among college students has garnered considerable national attention in recent years. That’s due in no small part to the growing cost of attendance, including housing. According to our tabulations of data from the College Board, room and board accounted for $11,140 of the estimated $21,370 it cost to attend a four-year public university in 2018 (Figure 1). And these costs have grown considerably: between 2000 and 2018, room and board increased 55 percent at these schools, even after adjusting for inflation, while tuition and fees doubled.
Figure 1: Costs at Public Universities Have Grown Significantly Over Nearly Two Decades
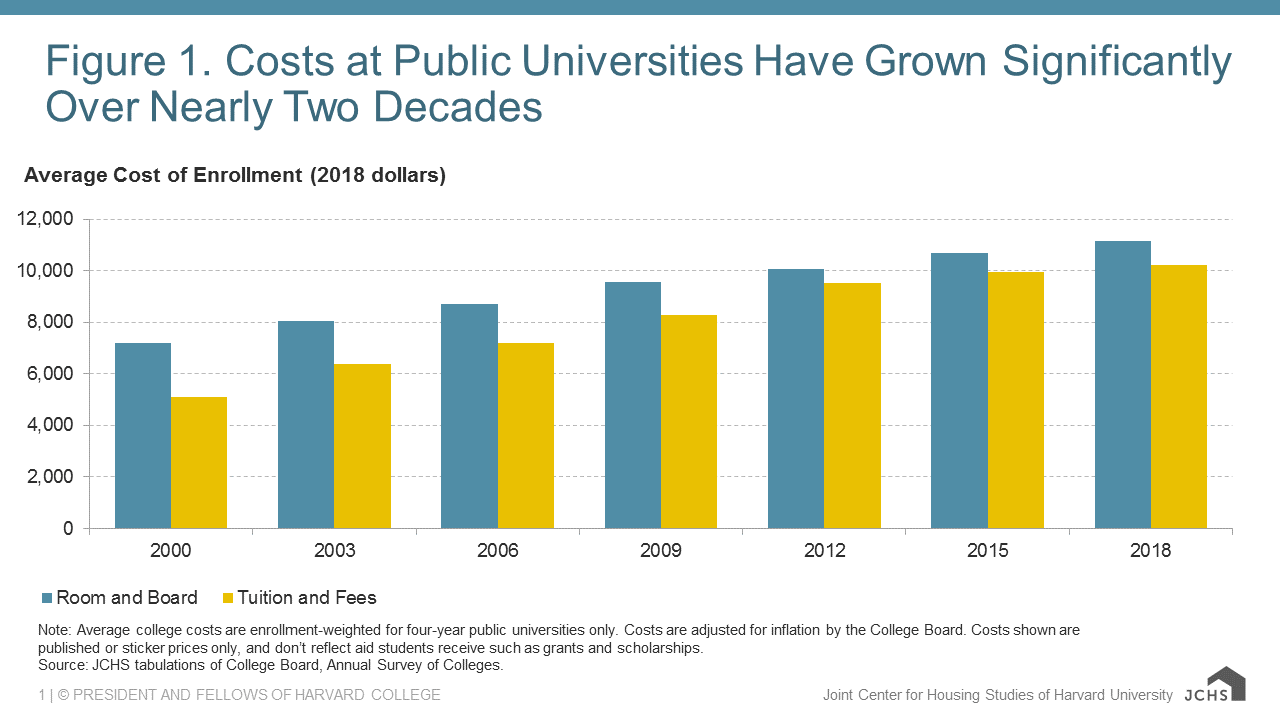
Note: Average college costs are enrollment-weighted for four-year public universities only. Costs are adjusted for inflation by the College Board. Costs shown are published or sticker prices only, and don’t reflect aid students receive such as grants and scholarships. Source: JCHS tabulations of College Board, Annual Survey of Colleges.
As a result, nearly 47 percent of the 5.6 million households headed by undergraduate or graduate students were cost burdened in 2017, nearly 16 percentage points higher than the cost-burden rate for all other households (Figure 2). However, this isn’t an apples-to-apples comparison. Households headed by college students are much younger, and 62 percent of households headed by college students are renters. In contrast, only 35 percent of all other households rent their home. But even among all other renters the differences in cost burdens are stark: 59 percent of college-student renters were cost burdened, 13 percentage points more than non-student renters. For student renters under age 35, an even higher 63 percent had cost burdens, nearly 20 percentage points higher than same-age renters not enrolled in college.
Figure 2: Households Headed by College Students Have Significantly Higher Cost-Burden Rates Than Other Households
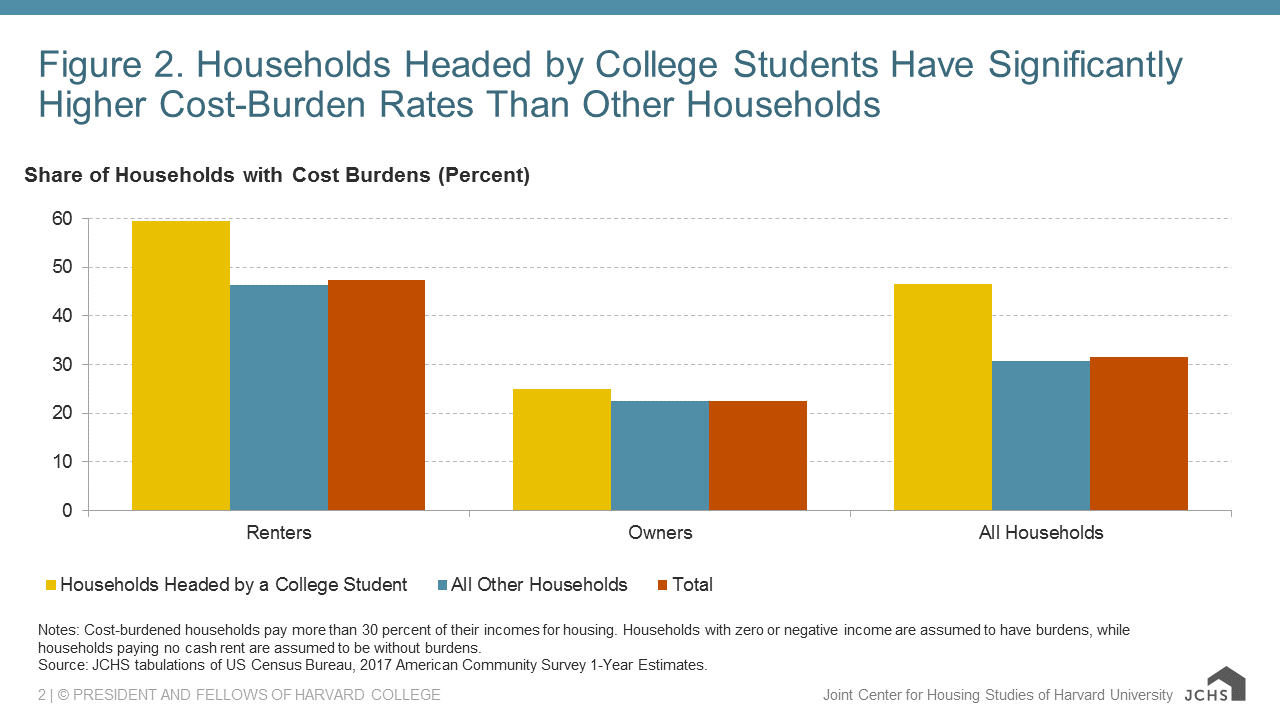
Notes: Cost-burdened households pay more than 30 percent of their incomes for housing. Households with zero or negative income are assumed to have burdens, while households paying no cash rent are assumed to be without burdens. Source: JCHS tabulations of US Census Bureau, 2017 American Community Survey 1-Year Estimates.
Given these differences, it’s important to ask: do students’ high cost-burden rates reflect the actual struggles that affordability metrics are meant to capture? The high burden rate among college students, for example, might not account for alternative sources of money used to pay for housing, such as funds from parents or student loans. Moreover, focusing on current cost-burden rates could obscure the fact that students’ deferment in income might represent a temporary hardship that leads to higher incomes after graduation. On the other hand, when students use loans to pay for housing, especially as enrollment costs rise, large future debts could impede their ability to pay for housing well into the future.
These nuances also illustrate a broader issue about the challenges of measuring housing affordability. For better or worse, the cost-burden rate is a relatively simple measure that compares a household’s income to its monthly housing costs. But students, who typically have very low incomes, are more likely to pay for housing through non-income sources such as money from relatives, loans, and grants. These payment sources aren’t categorized—nor should they be categorized—as income.
As a result, cost-burden rates are likely inflated in smaller markets with large shares of college students. Illustratively, one-in-ten households were headed by a student in 31 of the country’s 382 metro areas, most of them small- and mid-sized markets with large public universities. In these metros, nearly 53 percent of renter households were cost burdened in 2017, 6 percentage points higher than all renter households across the country (Figure 3). The actual burden rate varied considerably in these markets, ranging from a low of 39 percent in La Crosse, home of the University of Wisconsin–La Crosse, to a high of 65 percent in Gainesville, home of the University of Florida. All told, the cost-burden rate exceeded the national average in 23 of the 31 markets.
Figure 3: Cost-Burdens Are Typically Well Above Average in Markets with High Shares of College Students, But Are Much Lower When Looking Exclusively at Non-Student Households
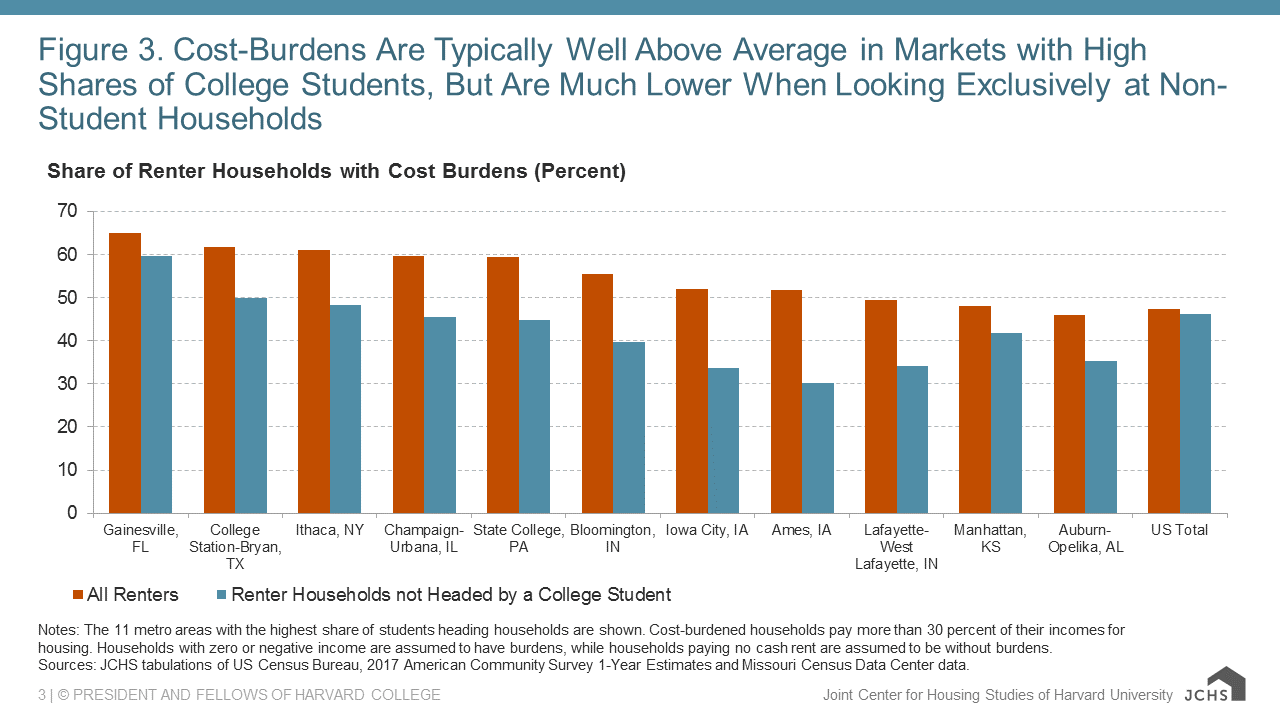
Notes: The 11 metro areas with the highest share of students heading households are shown. Cost-burdened households pay more than 30 percent of their incomes for housing. Households with zero or negative income are assumed to have burdens, while households paying no cash rent are assumed to be without burdens. Sources: JCHS tabulations of US Census Bureau, 2017 American Community Survey 1-Year Estimates and Missouri Census Data Center data.
If students are excluded from the metro cost-burden calculations, the share of renters with cost burdens dropped by 9 percentage points in these same 31 metros, and by about 1 percentage point in the nation overall. The share of households with cost burdens fell the most in markets with larger concentrations of students. For example, in Ames, Iowa, the home of Iowa State University, college students comprised 21 percent of all households. If student households are excluded from the cost-burden rate calculation, however, the renter burden rate drops from 52 percent to 30 percent.
Similarly, in Ann Arbor, where students make up 14 percent of households, the cost-burden rate drops nearly 9 percentage points if students are omitted, to 41 percent. That drop shifts Ann Arbor from the third highest cost-burden rate to the third lowest among the state’s 14 metros (ahead of Kalamazoo and Lansing, two other mid-sized markets with large public universities). Indeed, if college students are dropped from the cost-burden calculations, only 7 of the 31 college towns would have higher-than-average cost-burden rates. Gainesville would still have the highest share of renters with cost burdens at 60 percent, ahead of two Texas markets: Lubbock (54 percent) and College Station (50 percent).
There are several reasons why excluding college students would produce lower-than-average cost-burden rates in university-dominated metros. Many of these places are modest-sized markets, which generally have lower burden rates than large markets. Furthermore, the workforce attracted to markets with large universities often have higher incomes, which means they can pay more for housing.
Finally, this analysis suggests that the 30 percent of income standard for measuring housing affordability can be simplistic in some contexts, which is consistent with the findings of a recent working paper. As that paper explained, housing cost burdens tend to produce reliable aggregate estimates of affordability, but don’t account for the differential spending needs of families with small children, older adults, persons with health problems, or the full array of people’s living arrangements. This analysis shows how payment sources outside of income can also be problematic for measuring cost burdens. Unfortunately, information on these non-income payment sources isn’t often captured in the data. While this knowledge would help clarify the nature and extent of cost burdens in student-headed households, growing enrollments and the rising cost of attendance, combined with existing measurements, indicate that housing affordability is indeed a pervasive challenge for college students in markets across the country.