Government Benefits Reduce Housing Cost Burdens

The pandemic considerably worsened housing affordability for millions of renters across the country. The housing cost burden rate for renters (the share spending more than 30 percent of income on rent and utilities) rose by nearly 3 percentage points from 2019 to 2021 alone as rents increased rapidly and incomes took a hit. Difficult economic conditions were met with an expanded social safety net that included enhanced Child Tax Credits and SNAP benefits in addition to stimulus payments. While these additional supports may have helped alleviate the rise in housing cost burdens, none of these resources are accounted for in the typical cost burden measure. In a new Housing Studies paper, my coauthors and I examine how cost burden rate estimates change when taxes and government transfers such as those during the pandemic are included in the calculation.
The standard cost burden measure is based on the share of pretax income that a household spends on rent and utilities. Pretax income is easy for households to report but can obscure how policy changes impact housing affordability. Low-income households, for example, often receive the Earned Income Tax Credit, a crucial cash benefit not captured as part of household income that could reduce cost burdens. Conversely, households with tax liabilities may have less income available than their pretax earnings suggest, implying greater affordability challenges than standard measures indicate.
We use the American Community Survey (ACS) to estimate standard cost burdens over time based on pretax cash income. We compare these rates to adjusted estimates that incorporate components of the Supplemental Poverty Measure (SPM) using the US Census Bureau’s ACS SPM research files from 2009 to 2022. These files allow us to add the value of in-kind benefits from programs like SNAP or the Low-Income Home Energy Assistance Program to household income. These estimates also account for the amount of tax households likely pay as well as any tax credits they receive. We refer to this resulting amount as cash income, value of benefits, and taxes. Together, this creates a clearer picture of the total resources households have available.
In a typical year, the standard measure understates the extent of cost burdens for the general renter population because tax payments reduce household income. In 2022, 50 percent of renters were cost burdened using pretax cash income, rising to 55 percent when benefits and taxes are included. At the same time, standard measures overstate the occurrence of cost burden for renters in the lowest income quintile. While 83 percent were cost burdened in 2022, the share drops to 77 percent when incorporating benefits and taxes. This points to the fact that the social safety net is primarily geared toward these households, alleviating pressure on household budgets. But the small change in rate also illustrates that these resources are still not enough to offset the high cost of housing.
Figure 1: Government Transfers Through Benefits and Tax Credits Reduce Cost Burdens for the Lowest Income Renters
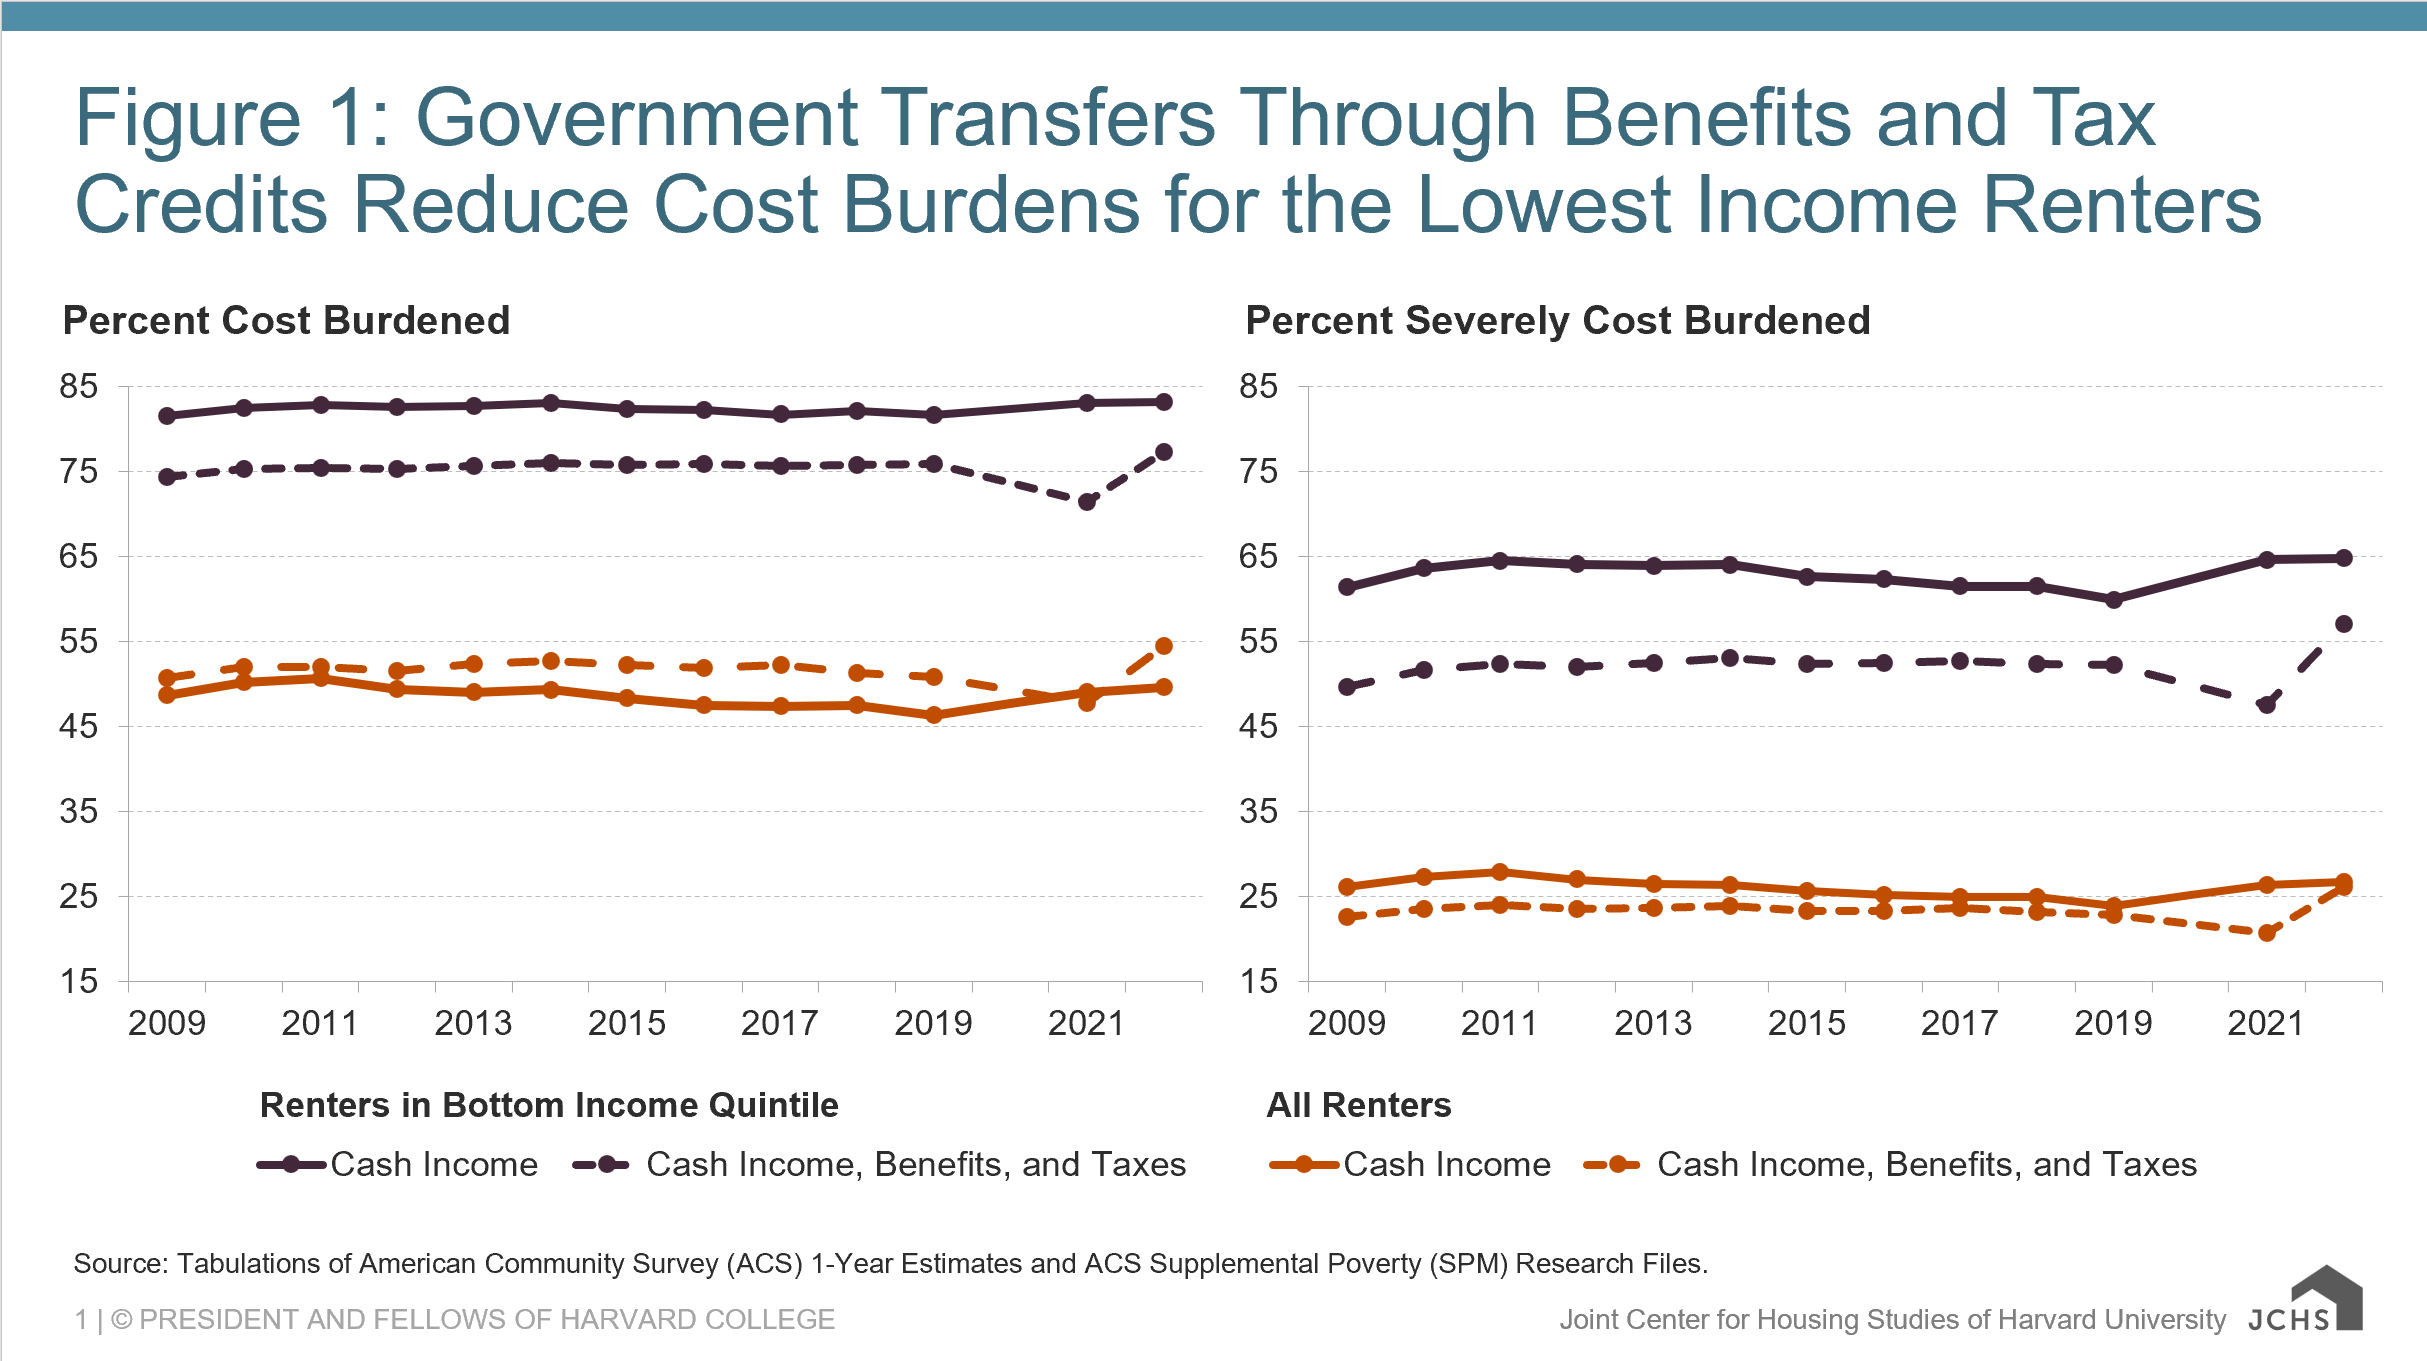
Source: Tabulations of American Community Survey (ACS) 1-Year Estimates and ACS Supplemental Poverty (SPM) Research Files.
The unique circumstances of the pandemic made it possible to explore the impact of expanded safety net programs on cost burdens. The standard cost burden measure showed a considerable increase of nearly 3 percentage points from 2019 to 2021 (Table 1). When increased benefits and tax credits during this period are taken into account, the cost burden rate dropped by 3 percentage points. More generous tax credits were the primary driver of this decrease and also reduced severe housing cost burdens. The effect was even larger for the lowest income renter households, who saw their adjusted cost burden rate fall by about 5 percentage points.
Table 1: Pandemic-Era Programs Reduced the Occurrence of Cost Burdens
Percent Cost Burdened
|
Any Burden |
Severe Burden |
|||||
|
2019 |
2021 |
2022 |
2019 |
2021 |
2022 |
|
| All Renters | ||||||
| Cash Income |
46 |
49 |
50 |
24 |
26 |
27 |
| Cash Income and Benefits |
44 |
46 |
47 |
21 |
23 |
24 |
| Cash Income, Benefits, and Taxes |
51 |
48 |
55 |
23 |
21 |
26 |
| Renters in Bottom Income Quintile | ||||||
| Cash Income |
82 |
83 |
83 |
60 |
65 |
65 |
| Cash Income and Benefits |
76 |
78 |
78 |
52 |
57 |
57 |
| Cash Income, Benefits, and Taxes |
76 |
71 |
77 |
52 |
48 |
57 |
Source: Tabulations of American Community Survey (ACS) 1-Year Estimates and ACS Supplemental Poverty (SPM) Research Files.
The gap between the two cost burden measures was largest for the lowest income households in 2021 when standard metrics did not capture the unusually generous social safety net. Yet even during this period of additional income support, 48 percent of all renters and 71 percent of the lowest income renters were burdened by housing costs. Thus, pandemic-era programs quickly reduced the occurrence of housing cost burden when it otherwise would have increased, but persistently high rates of burden remained. The gains were also short-lived as cost burden rates rose rapidly in 2022 when these programs expired.
Our findings underscore the importance of the social safety net and tax policy in supplementing household incomes. Notably, housing affordability challenges are staggeringly common, regardless of whether government transfers are included. However, comparing these measures of cost burden illustrates how policy changes can quickly reduce cost burdens and improve the material well-being of renter households.


