
Price-to-Income Ratios are Nearing Historic Highs
The typical sale price of an existing single-family home in 2017 was 4.2 times greater than the median household income, according to our latest State of the Nation’s Housing report. That’s a significant increase from 2011, when the price-to-income ratio was 3.3, and 1988, when it was 3.2.
The report also notes that price-to-income ratios vary considerably across the country. As our interactive map shows, the median sale price in 2017 was more than eight times greater than incomes in 12 metropolitan areas, all of them in the West (Figure 1). Price-to-income ratios topped 10.0 in both the Santa Cruz and San Jose metro areas and neared 10 in Los Angeles. On the other hand, ratios were well below 3.0 in much of the Midwest and Northeast, including Youngstown, Syracuse, Toledo, and Pittsburgh.
Figure 1. Home Price-to-income Ratios, 1980-2017 (Interactive)
Home Price-to-Income Ratios, 1980-2017
The map, which allows users to visualize price-to-income ratios from 1980 to 2017 for 382 metropolitan areas, also shows that in 1988 home prices were five times greater than incomes in only seven markets and the highest price-to-income ratio in the country was 6.7 (in the Naples, Florida metro area). Moreover, three-quarters of metro areas had price-to-income ratios below 3.0, including several areas where home prices now greatly exceed average incomes. Illustratively, between 1988 and 2017, price-to-income ratios more than doubled in Miami (from 2.9 to 6.3), Denver (2.7 to 5.5), and Seattle (2.5 to 5.7).
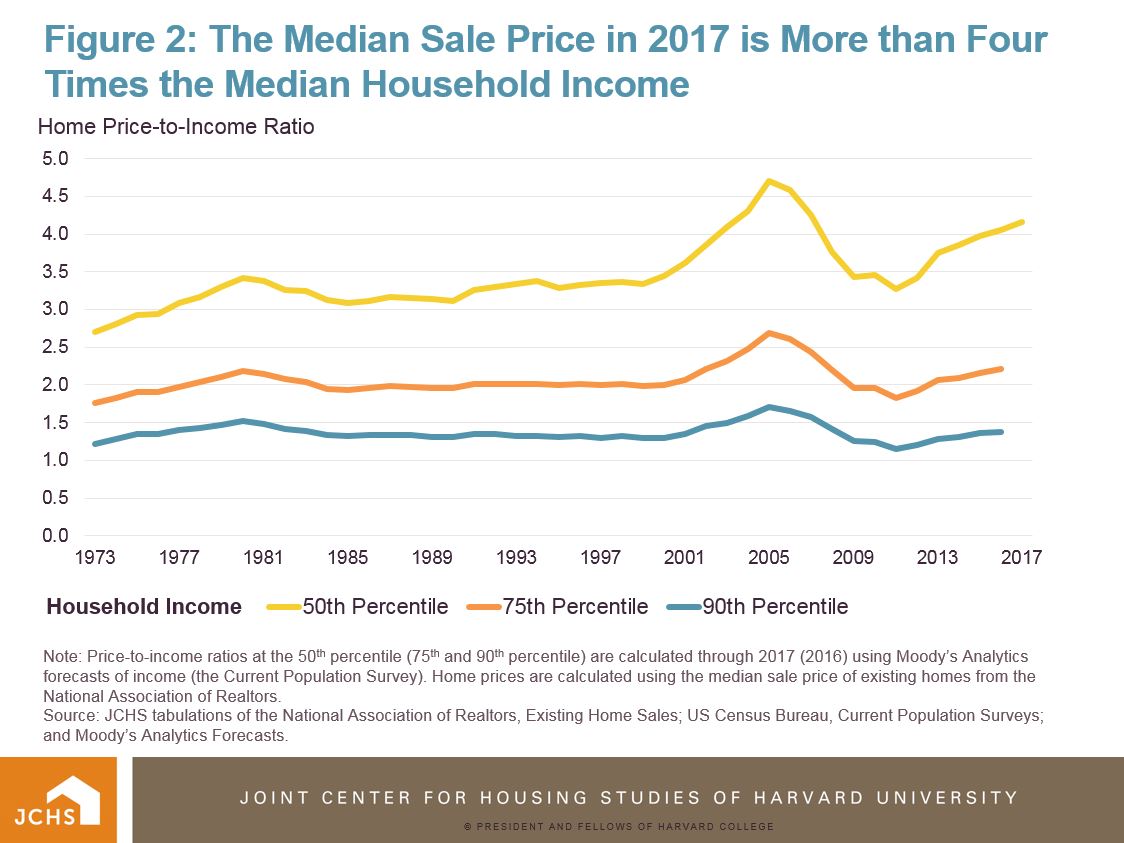
As high as they are today, price-to-income ratios are still below the all-time highs seen during last decade’s housing boom (Figure 2). In fact, price-to-income ratios nationally were remarkably stable between 1980 and 1999, when they fluctuated between 3.1 and 3.4. But in the early 2000s, home price growth far surpassed income growth for six years. As a result, in 2005, the national price-to-income ratio rose to 4.7, the highest it has been since at least 1980.
Figure 2: The Median Sale Price in 2017 is More than Four Times the Median Household Income
Across markets, price-to-income ratios peaked in 226 of 382 metro areas between 2005 and 2009 (with 99 of those metros peaking in 2006). The 226 metros include most large metro areas in the Northeast and West, such as Los Angeles (11.7), New York (7.5), Boston (6.5), and Seattle (6.1), as well as Washington, DC (5.5), Chicago (4.7), Baltimore (4.6), and Detroit (3.6).
However, due to recent rapid increases in home prices, 67 metros recorded their highest price-to-income ratios in 2015–2017. These markets, which are concentrated in the South, include Atlanta (3.1); several mid-sized but fast-growing metros such as Durham (4.4), Nashville (3.8), and Charlotte (3.6); and most of the “Texas Triangle,” including Austin (4.0), Houston (3.7), and San Antonio (3.7). In addition, price-to-income ratios hit new highs in a few Western areas, such as San Jose (10.0), Denver (5.5), and Salt Lake City (4.2); and in a few more affordable Midwestern markets, including Indianapolis (2.9), Des Moines (2.8), and Omaha (2.8).
The generally higher ratios today (as compared to 30 years ago) are the result of rapid growth in home prices, relatively stagnant incomes, and historically low interest rates which, by lowering the cost of obtaining a mortgage, have allowed buyers to bid up prices. Moreover, because incomes have risen faster for more affluent people, income growth at the high end has more closely tracked changing home prices, especially in places where inventories have been constrained and competition for housing has been fierce. In fact, according to our tabulations of income data from the Current Population Survey, the price-to-income ratio for households at the 90th percentile of income was 1.4 in 2016, almost exactly on par with the 1.4 average since 1980 and only slightly less than the peak of 1.7 in 2005.
The rise in home prices relative to incomes has fueled growing concerns about housing affordability, especially for low- and moderate-income households in markets where the ratios are high and rising. Moreover, the long, secular decline in interest rates that has kept monthly mortgage costs relatively affordable appears to be ending. Consequently, future price increases could lead more directly to increases in mortgage payments.