
Home Repair Programs Serve Critical Needs for Low-Income and Vulnerable Homeowners
Many lower-income homeowners rely on the assistance of municipal home repair programs for their emergency and chronic structural, plumbing, electrical, and mechanical home repair and replacement needs. Most of the largest cities in the US offer grants or loans to lower-income homeowners who might otherwise be unable to make these repairs, according to a review of municipal home repair programs conducted for the Center’s Remodeling Futures Program.
Municipal home repair programs are vitally important for addressing housing inadequacy among homeowners with limited resources. Lower-income households are disproportionately likely to live in inadequate or substandard housing, and as reported in our latest Improving America’s Housing report, a large share of homeowners make little to no investment in home repairs and improvements in any given year. Indeed, a much smaller share of lower-income owners make home repairs and upgrades compared with higher-income owners. However, while they spend significantly less on average, this spending represents a considerable share of their incomes.
Consequently, a range of public- and civil-sector providers have stepped in to assist. The US Department of Energy’s Weatherization Assistance Program improves energy conservation and efficiency for many low-income households nationally, administered through state governments and local community action agencies. Very low-income rural homeowners can also receive assistance from the US Department of Agriculture’s Section 504 Home Repair loan and grant program. National non-profits such as Rebuilding Together, Habitat for Humanity, and the Green and Healthy Homes Initiative also help to fill these capacity holes.
Municipal programs that offer eligible homeowners free services, grants, and loans for repairs play a crucial role as well. To better understand the nature of these programs, we reviewed publicly available information and collected data on 113 programs in the 100 largest US cities during the fall of 2021 and winter of 2022. Additional data about the number of units served, average cost of repair, and overall program budget were collected from a subset of 26 programs. We found that over half of major US cities have home repair loan programs and nearly a third have grant programs (Figure 1). The programs are relatively small and have varying guidelines around who is eligible, what types of repair and replacement work can be funded, and how much can be spent per participant.
Figure 1: Most of the Largest Cities Offer Home Repair Assistance to Eligible Owners as Loans or Grants
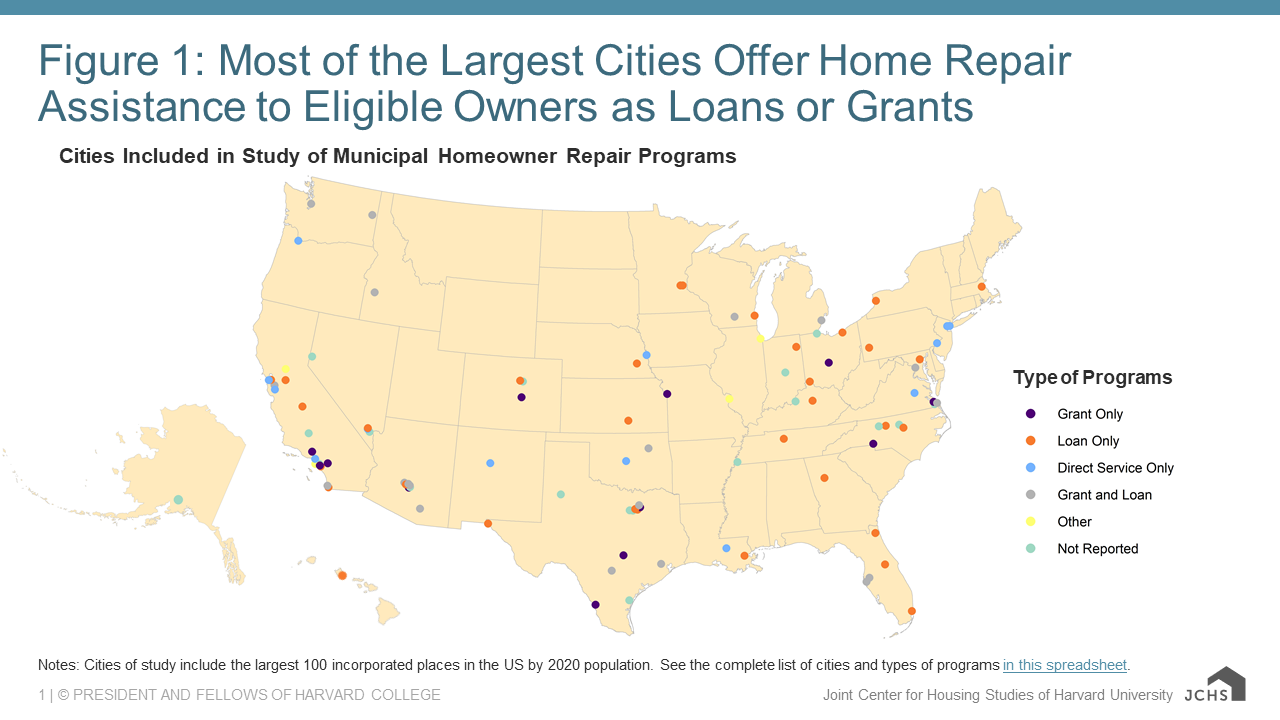
Notes: Cities of study include the largest 100 incorporated places in the US by 2020 population. See the complete list of cities and types of programs in this spreadsheet.
Municipal home repair program funding most often comes from federal sources, namely the US Department of Housing and Urban Development’s (HUD) Community Development Block Grant Program (CDBG). Since the 1970s, CDBG has provided a flexible source of funding to states, cities, and counties to assist with a variety of community development and revitalization programs. CDBG allocations take into account a jurisdiction’s population, the proportion of households living in poverty, and the number of overcrowded housing units and those built before 1940. Of the 62 programs reporting main sources of program funding, two-thirds rely on federal funding as their primary source. Twenty-one percent of programs receive a portion of their funding from local public sources, and 6 percent are funded by private or state entities.
Program budgets vary based on the population size of the municipality. Of the 25 programs reporting overall program budgets, 36 percent have an annual budget of less than $500,000 including Buffalo, North Las Vegas, and Richmond. Twenty-four percent have a budget between $500,000 and $1,000,000 including Kansas City, St. Paul, and Virginia Beach, while about 40 percent have annual program budgets of $1,000,000 or more including some of the largest cities in the US: Dallas, Los Angeles, and San Jose.
Because of their shared federal funding sources, most municipal home repair programs follow income eligibility guidelines set by HUD. Fully 82 percent of programs surveyed use HUD median family income guidelines to determine program eligibility—a criterion that varies significantly across the country from less than $60,000 in El Paso, for example, to almost $169,000 in San Jose. Eighteen percent of programs consider the age of the applicant with a focus on assisting older homeowners’ repair needs. A few programs (6 percent) consider the disability status of the homeowner or household occupants when determining program eligibility.
There is wide variation among city home repair programs in the total amount of funding available to eligible homeowners. Of the 59 programs that reported maximum eligible funding per household, 15 percent offer maximum assistance of less than $5,000 for critical repair projects, 30 percent offer maximum funding between $5,000 and $19,999, and another 34 percent offer total assistance between $20,000 to $49,999 (Figure 2). About 21 percent offer a maximum of $50,000 or more. Significantly, most grant programs (80 percent) offer maximum funding per household of less than $20,000 whereas the majority of loan programs (69 percent) offer higher maximum funding levels of $20,000 or more.
Figure 2: Maximum Funding from Home Repair Programs Varies Significantly, But Most Repairs Are Completed for Less than $20,000
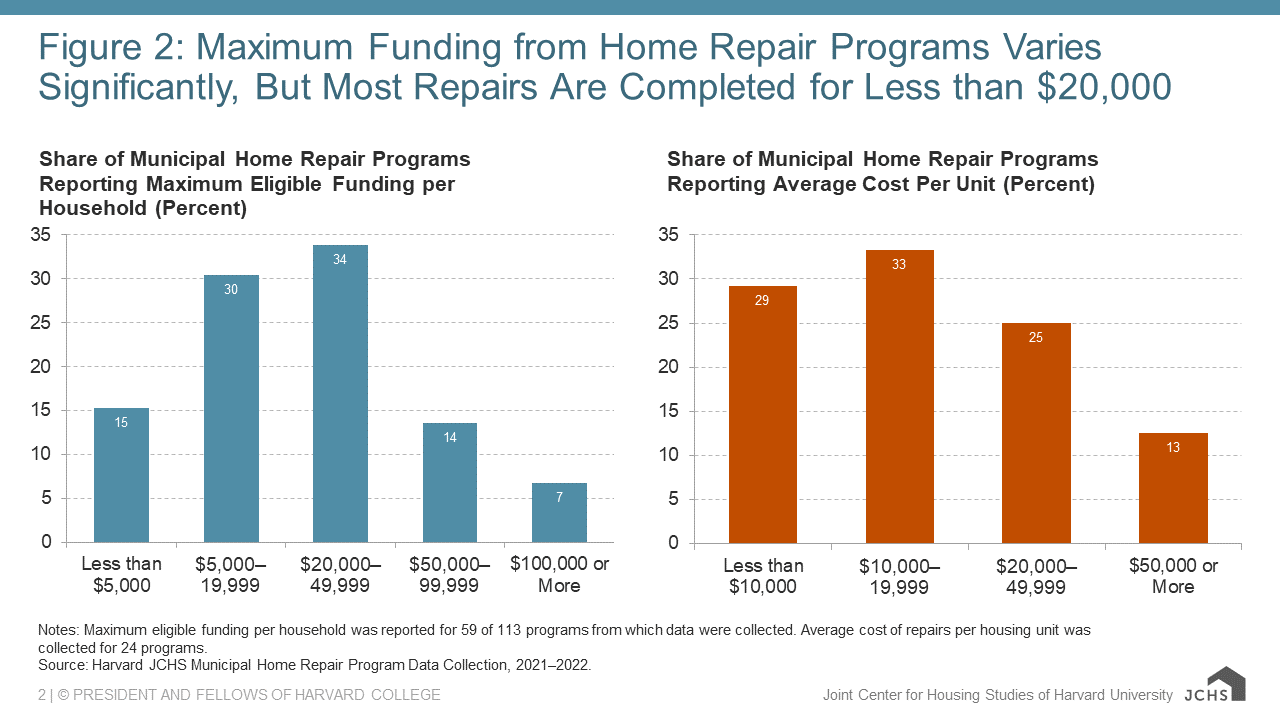
Notes: Maximum eligible funding per household was reported for 59 of 113 programs from which data were collected. Average cost of repairs per housing unit was collected for 24 programs.
Source: Harvard JCHS Municipal Home Repair Program Data Collection, 2021–2022.
In terms of average spending on critical home repair projects, most municipal programs report spending less than $20,000 per household. Of the 24 programs reporting average per unit expenditures, 29 percent spend less than $10,000 for the repair needs of the typical program participant, while another third of programs average spending between $10,000 and $20,000 per household. A quarter of programs spend between $20,000 and $50,000 per household and 13 percent spend over $50,000 per household on average.
The type of repairs eligible under municipal repair programs are as varied as the amount of assistance provided. Most programs offer a combination of structural, plumbing, and electro-mechanical repairs. Almost two-thirds (63 percent) offer repairs to electrical and mechanical systems such as HVAC or wiring (Figure 3). Fifty-seven percent offer assistance for plumbing projects such as water or sewer lines, fixtures, or pipes. Over half of programs (52 percent) cover structural repairs such as roofing, posts and beams, porches, or walls. More than a third (35 percent) offer mobility or accessibility improvements or repairs such as ramps and grab bars, typically for older homeowners or those with disabilities. About a quarter (24 percent) cover environmental hazard remediation for lead poisoning, mold, and asbestos. Finally, fewer than one in five programs (19 percent) offer aesthetic maintenance such as painting and landscaping.
Figure 3: Electro-Mechanical, Plumbing, and Structural Are Top Home Repairs Addressed by City Programs
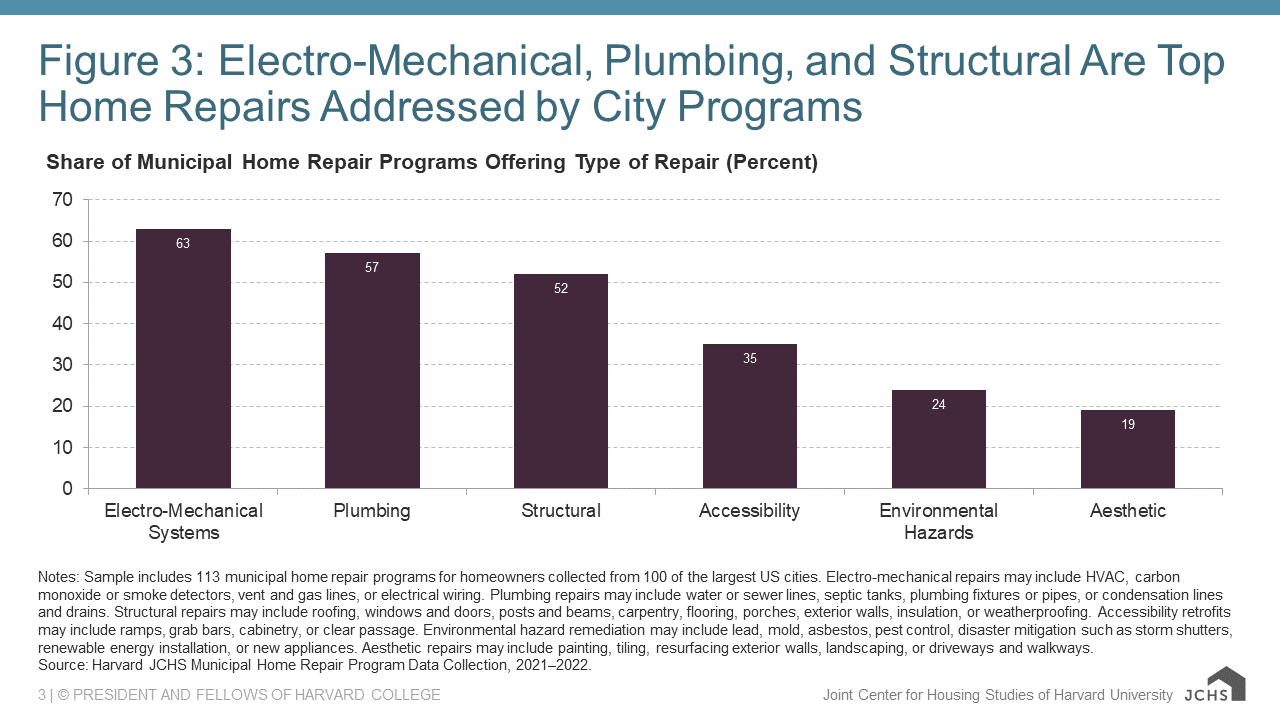
Notes: Sample includes 113 municipal home repair programs for homeowners collected from 100 of the largest US cities. Electro-mechanical repairs may include HVAC, carbon monoxide or smoke detectors, vent and gas lines, or electrical wiring. Plumbing repairs may include water or sewer lines, septic tanks, plumbing fixtures or pipes, or condensation lines and drains. Structural repairs may include roofing, windows and doors, posts and beams, carpentry, flooring, porches, exterior walls, insulation, or weatherproofing. Accessibility retrofits may include ramps, grab bars, cabinetry, or clear passage. Environmental hazard remediation may include lead, mold, asbestos, pest control, disaster mitigation such as storm shutters, renewable energy installation, or new appliances. Aesthetic repairs may include painting, tiling, resurfacing exterior walls, landscaping, or driveways and walkways.
Source: Harvard JCHS Municipal Home Repair Program Data Collection, 2021–2022.
To perform the home repair work, over 80 percent of the 47 programs reporting on repair implementation make use of licensed private contractors. Volunteers or staff of a local charity, such as Habitat for Humanity or Rebuilding Together, are a distant second (23 percent).
Of the 22 programs where data was provided, about two-thirds serve less than 100 households per year, while almost a third serve over 100 households annually. It is important, however, to note the impact of the pandemic on the programs surveyed. When asked about the number of housing units repaired annually, many reported a significant decrease during the pandemic due to an inability to conduct work safely and/or secure labor and materials.
Certainly, municipal home repair programs meet a critical need for addressing housing inadequacy. The overarching goal of these programs is to make sustainable, healthy, and safe housing improvements and repairs accessible to lower-income homeowners. Yet, the scope and availability of the programs vary widely. Although larger cities tend to have higher budgets and serve more households, none of the programs have sufficient funds to meet the needs of all homeowners residing in their jurisdictions who qualify for assistance. But the benefits to public health, household safety and financial security, and community cohesion vastly outweigh the costs of these relatively modest investments in home maintenance and repair.