
Young Families and the Growing Number of New Single-Family Rentals
While still a relatively small share of all new housing, record numbers of single-family rentals were built in 2020. And young, modest-income families with children are more likely to live in these units because of the space they provide (compared to new multifamily rentals) and their relative affordability (compared to new single-family homes for-sale).
Construction of single-family units intended for the rental market increased steadily over the past decade. According to our tabulations of Census Bureau New Residential Construction data, 49,000 single-family rentals were started last year, up from 14,000 at the bottom in 2009 and surpassing the previous high of 47,000 in 2003 (Figure 1). However, single-family rentals remained just under 4 percent of total housing construction and 12 percent of rental construction. Despite being a small share of the market, these units could provide much-needed housing at modest rent to households that are difficult to serve with new construction.
Figure 1: Single Family Rental Construction Reached New Highs in 2020, But Remained a Small if Growing Share of Total Construction
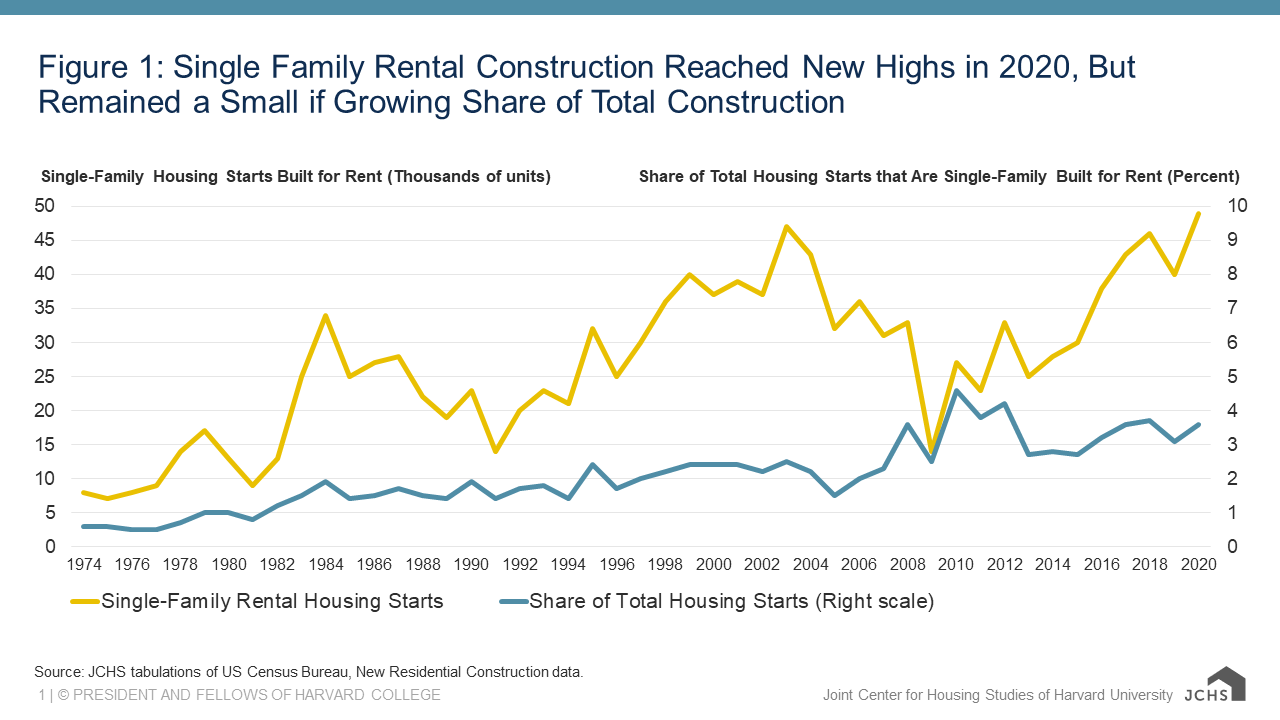
Source: JCHS tabulations of US Census Bureau, New Residential Construction data.
Helping to spur new construction, demand for single-family rentals has likely increased since the start of the COVID-19 pandemic. Indeed, single-family homes provide additional space for home offices, exercise, and remote learning; offer access to private outdoor space; and are often located in suburban areas—all characteristics associated with rising demand over the past year. At the same time, home prices have risen considerably in the for-sale market, making homebuying difficult for many moderate-income families who cannot afford rising prices and larger downpayments. Many of these young families are looking to the rental market, especially single-family rentals, to accommodate their needs. Increased construction of single-family rentals could help satiate some of this growing demand.
Tabulations of the 2019 American Community Survey suggest that young, modest-income households with children are more likely to live in new single-family rental units. Indeed, there were just under 58,000 occupied single-family rental units built in 2018-19, representing a fraction of the 44 million renter households nationwide. Relative to newer multifamily units built in 2018-19—which numbered 218,000 occupied units—newer single-family rentals were much more likely to house married couples and single parents. For example, 46 percent of households in newer single-family rentals were married couples with children (26 percent) or without children (20 percent), twice the rate of married couples in newer multifamily rentals (23 percent). An additional 13 percent of renters in new single-family rentals were single-parent households, again nearly twice the rate of households in new multifamily units (7 percent). In total, 39 percent of households in new single-family rentals had children, compared with just 14 percent of households in new multifamily units.
Households with children are more likely to choose new single-family rentals because they offer more space for families. Fully three quarters of these rentals had three or more bedrooms (77 percent), compared with just 11 percent of new multifamily rentals. Indeed, nearly half of new multifamily homes (49 percent) were 1-bedroom or studio apartments (Figure 2). New single-family rentals were also built in low- and moderate-density areas, predominately more suburban communities. Nearly two-thirds (64 percent) of new single-family rentals were located in a Public-Use Microdata Area (PUMA) in the bottom half of household density nationally, compared with under one-third (32 percent) of new multifamily rentals.
Figure 2: New Single-Family Rentals Are Larger and More Likely to Be Located in Lower Density Areas than New Multifamily Rentals
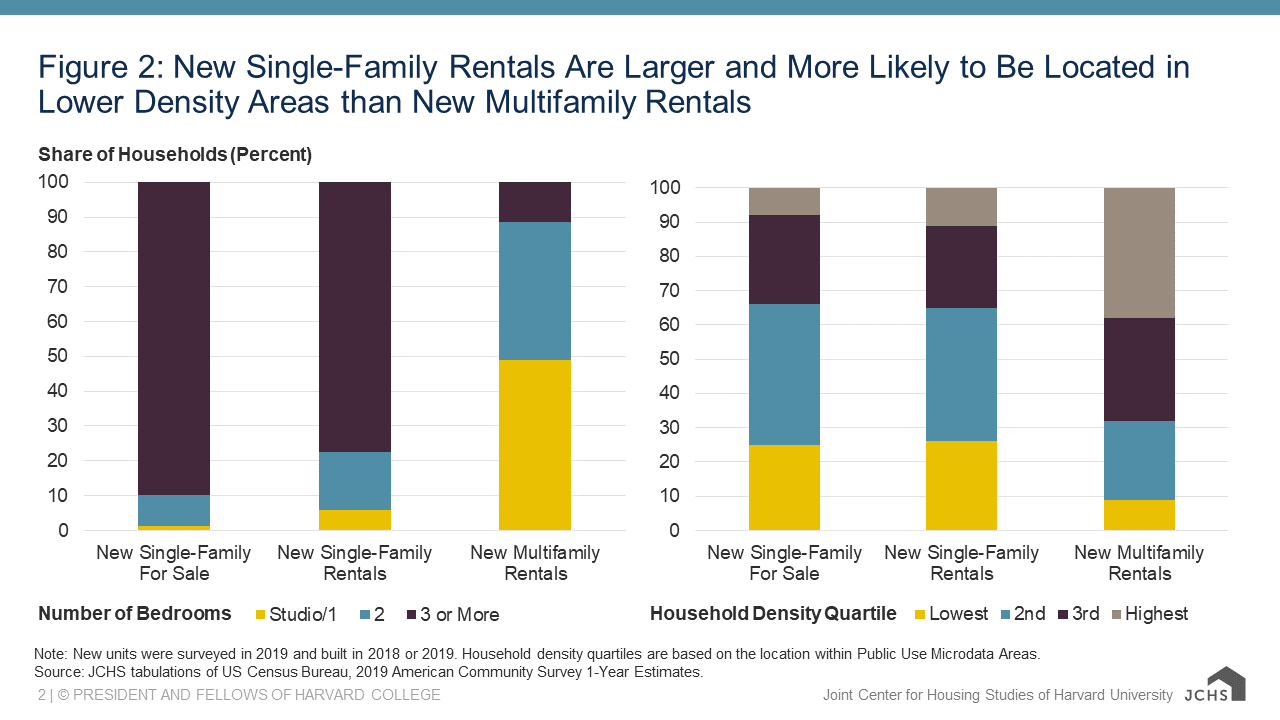
Note: New units were surveyed in 2019 and built in 2018 or 2019. Household density quartiles are based on the location within Public Use Microdata Areas.
Source: JCHS tabulations of US Census Bureau, 2019 American Community Survey 1-Year Estimates.
With respect to their size, location, and the types of households served, single-family rentals are more akin to single-family homes built for sale, but differ markedly in their relative affordability. The typical homeowner with a mortgage living in a new single-family home spent $2,208 per month on their housing, 33 percent higher than the $1,666 per month renters in new single-family units spent on rent and utilities (Figure 3). However, comparing rental and homeowner costs is difficult, and doesn’t account for differences in up-front costs to purchase or rent a home. Instead, it may be more instructive to compare incomes. The median household income for homeowners in new single-family units was $114,000, fully 48 percent higher than the $77,000 median household income among renters in new single-family rentals. By comparison, the median income for all renter households was $42,000. Additionally, the modest costs mean that new single-family rentals are more often occupied by younger households. Fully 41 percent of households in these units were under age 35 compared with 25 percent of households in new, owner-occupied single-family homes.
Figure 3: Households In New Single-Family Rentals Typically Have Modest Rents and Household Incomes
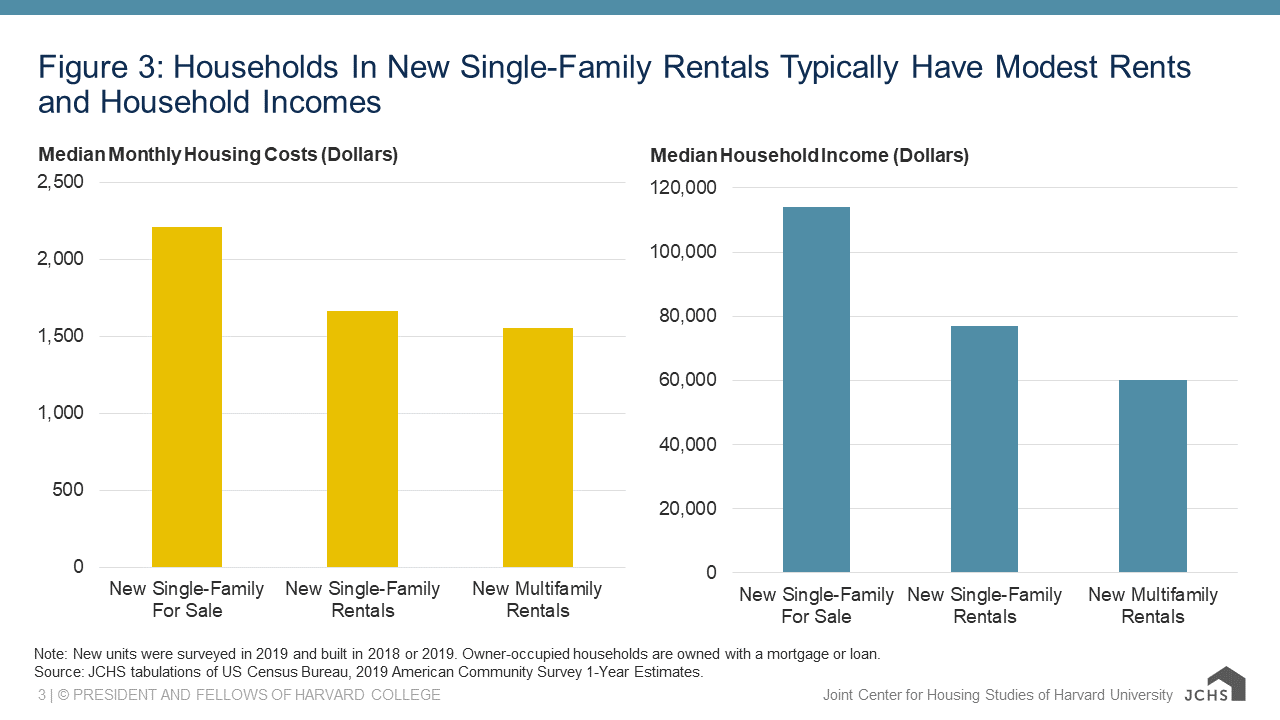
Note: New units were surveyed in 2019 and built in 2018 or 2019. Owner-occupied households are owned with a mortgage or loan.
Source: JCHS tabulations of US Census Bureau, 2019 American Community Survey 1-Year Estimates.
Single-family rentals provide important housing options for younger, modest-income families with children. In many mid-sized markets especially, new single-family rental construction could serve the same constituents targeted by “workforce housing” programs minus the need for public subsidies. However, though production of these units has increased in recent years, many obstacles remain. The typical impediments to single-family homebuilding—including the rising cost of land, labor, and materials, plus excessive local land-use regulations—also hinder single-family rental construction in many markets. Moreover, financing rental construction brings added layers of complexity. Additional research should shed light on the demand for these units and the potential for private and public actors to overcome these challenges.