What Can Measures of Residual Income Tell Us About Affordability?
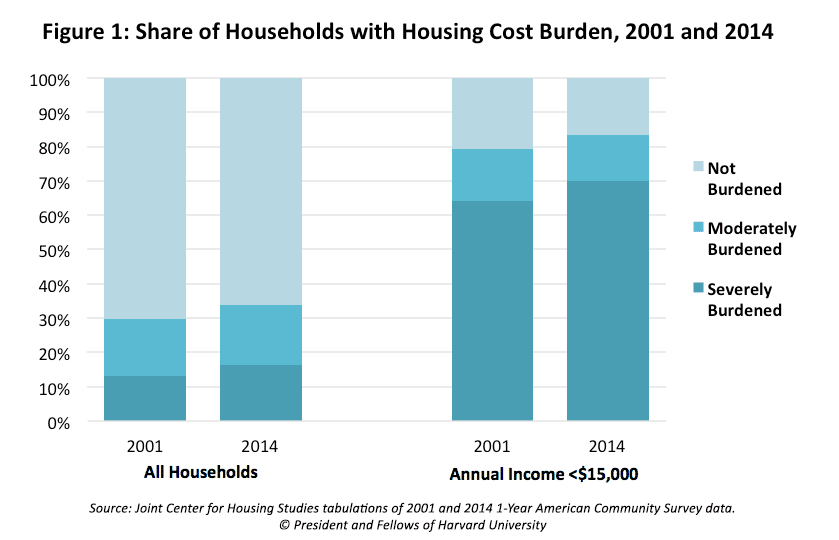
JCHS analysis of American Community Survey data in our recent State of the Nation’s Housing indicates that the share of households with housing cost burdens—those paying 30 percent or more of income toward housing—has increased since the turn of the 21st century (Figure 1). Rising cost burdens have hit low-income households especially hard: among households with annual incomes under $15,000, 83.4 percent had housing cost burdens in 2014, with 70 percent facing severe cost burdens—paying at least 50 percent of income toward housing.
This changing distribution of housing cost burdens clearly indicates that housing affordability has become more of a problem for a larger share of households in recent years. However, cost burden measures alone provide limited insight into the extent to which housing costs constrain a household’s resources, capacity to save, and overall financial wellbeing. To answer these questions, we need an additional way to measure housing affordability. This blog post therefore constructs measures of residual income after housing costs using data from the Consumer Expenditure Survey (CES) to examine the extent to which rising housing cost burdens have eroded households’ ability to afford other basic costs of living during the first years of the 21st century.

This discussion examines average residual income for consumer units that participated in the Consumer Expenditure Survey between years 2000 and 2013. For simplicity, we use the term “household” to refer to the CES-defined consumer units, which are occasionally smaller than households in cases where financially independent families or roommates live in the same housing unit. Dollars are adjusted for inflation using CPI-U All Items Less Shelter, a deflator neutral to housing cost increases. To account for the introduction of income imputation in 2004, we analyze reported (non-imputed) rather than imputed income data even in years where imputed data is available, and limit our sample to complete income reporters.
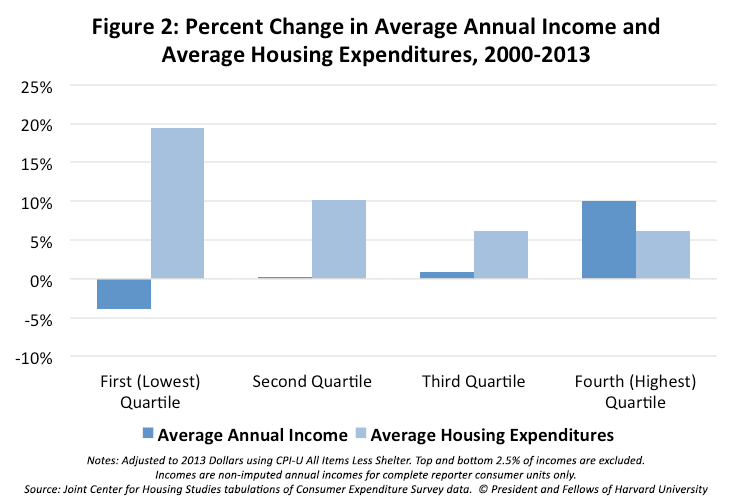
Analysis of CES data confirms that rising housing cost burdens are the result of countervailing trends in housing expenditures and incomes (Figure 2). Households in every income quartile spent more on housing in 2013 than in 2000, with households in the bottom income quartile experiencing the steepest increases. For the bottom income quartile, average housing expenditures climbed almost 20 percent over the period. The second quartile saw more moderate but still sizeable increases of just over 10 percent, and the two upper income quartiles each spent an average of 6 percent more on housing in 2013 than in 2000.
While housing expenditures were on the rise between 2000 and 2013 for all income quartiles, real income growth trended in opposite directions during the same period for households at the top and bottom of the income ladder. Analysis of CES data indicates that real average income fell by almost 4 percent for the lowest income quartile, while the highest income quartile saw average income grow by fully 10 percent—more than offsetting concurrent increases in housing expenditures.

Source: JCHS tabulations of Consumer Expenditure Survey data.
These divergent trends in housing expenditures and incomes have produced a widening residual income inequality gap. For all but the highest income quartile, the average amount of residual income remaining after paying for housing has declined, with households in the lowest income quartile seeing the sharpest declines (Figure 3). The lowest-income households already had very little monthly residual income in 2000 ($575 per month), yet by 2013, residual income had fallen even farther, to just $423 per month—a decline of over 26 percent in real terms. As these figures show, between 2000 and 2013 all but the highest income households became less able to afford basic costs of living after paying for housing.
Figure 3: Average Monthly Residual Income after Housing, 2013 Dollars
| 2000 | 2013 | Percent Change | |
| Lowest Quartile | $575 | $423 | -26.4 |
| Second Quartile | $1,879 | $1,809 | -3.7 |
| Third Quartile | $3,980 | $3,958 | -0.6 |
| Fourth Quartile | $8,017 | $8,886 | +10.8 |
Notes: Adjusted to 2013 Dollars using CPI-U All Items Less Shelter. Top and bottom 2.5% of incomes are excluded. Incomes are non-imputed annual incomes for complete reporter consumer units only.
Source: JCHS tabulations of Consumer Expenditure Survey data
The hardships associated with housing cost increases may be particularly severe for low-income seniors, single parents, individuals with disabilities, and other households with fixed incomes or necessary expenditures on healthcare, childcare, or other basic needs. For example, analysis of CES data indicates that in 2013, while a household in the first income quartile headed by an individual under the age of 65 paid an average of $166 per month in healthcare costs, a senior-headed household in the first quartile paid more than one and a half times that, averaging $275 per month. After accounting for housing costs, a senior household in the first income quartile had just $519 left to finance all other costs of living—meaning that in 2013, the average low-income senior household paid more than half their residual income toward healthcare. As these figures illustrate, rising housing costs do not carry similar consequences for all households. Instead, households with the least cushion in their budgets are the most vulnerable to increases in the cost of housing.
The use of residual income measures highlights the implications of rising housing costs for household budgets, shedding light on the extent to which rising housing costs have exacerbated the consequences of growing income inequality. As the figures above show, income growth stagnated or declined for all but the highest income households between 2000 and 2013. At the same time, households with the lowest incomes experienced the largest percentage change in their housing costs, compounding the effects of the income trends. The upshot is that lower-income households have become less able to afford not only housing, but also all other non-housing costs of living since the turn of the 21st century.

