
The Continuing Decline of Low-Cost Rentals
The growth in high-income renters, the nation’s limited housing supply, and the tendency for new construction to be aimed at the top of the market have all contributed to the decline in low-cost rental housing over the past several decades, according to our America’s Rental Housing 2020 released earlier this year. The findings in the report build on a working paper I wrote last year with my colleagues Elizabeth La Jeunesse, Daniel McCue, and Jonathan Spader. Our paper documented the decline in low-cost rentals across the nation and by state from 1990 to 2017. However, updates to the analysis using new data show that the decline in the nation’s most affordable stock continued unabated in 2018, the most recent year for which data are available. While it’s too soon to say how COVID-19 will affect rental markets, the data show that low-cost housing was already scarce entering the crisis.
Indeed, the number of units renting for under $600 after adjusting for inflation—the maximum affordable to a household earning $24,000 per year—declined by an additional 410,000 units in 2018. As a result, just 10.5 million homes across the country rent for that amount. The decrease in 2018 brings the longer-run decline in units renting for under $600 to 2.3 million since 2000 (Figure 1). Over that same period, units renting for $600 or more increased by about 11.5 million, pushing the share of the stock renting for under $600 from 36 percent in 2000 to just 23 percent in 2018. (As with the working paper, I adjust all dollar values for inflation using the CPI-U for all items less shelter. Additional details about our methods can be found in the paper.)
Figure 1: Low-Cost Units Account for a Shrinking Share of the Nation’s Rental Stock
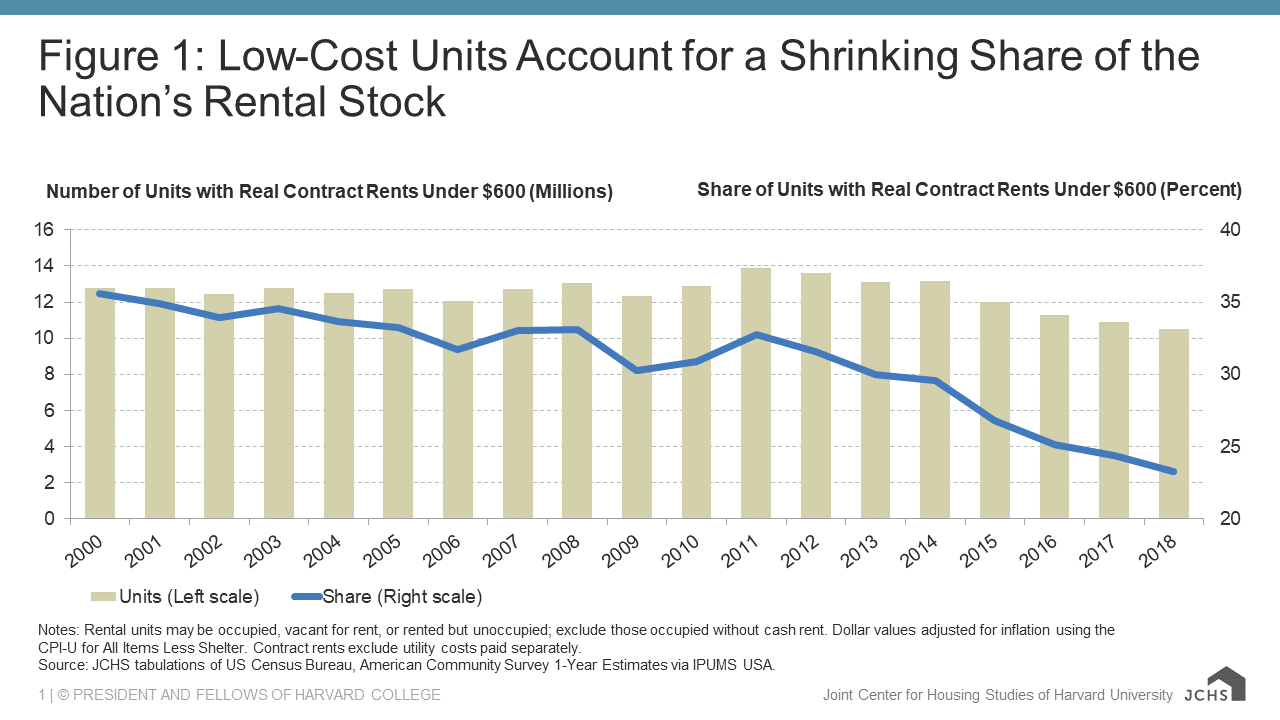
Notes: Rental units may be occupied, vacant for rent, or rented but unoccupied; exclude those occupied without cash rent. Dollar values adjusted for inflation using the CPI-U for All Items Less Shelter. Contract rents exclude utility costs paid separately.
Source: JCHS tabulations of US Census Bureau, American Community Survey 1-Year Estimates via IPUMS USA.
While the number of units renting for under $600 this century peaked in 2011, the decline in such units has been especially sharp since 2014. Between 2014 and 2018, the number of low-cost rentals dipped by 2.7 million units, a rate of more than half a million units per year. But as the paper details extensively, quantifying the loss of low-cost units depends in part on the definition of “low-cost.” What is considered reasonably low cost varies significantly with state and local market conditions. In other words, low-cost housing in Omaha rents for much less than low-cost housing in Los Angeles.
However, the decline in low-cost housing nationally has occurred at various rent levels. From 2014 to 2018, units renting for under $400 declined by 904,000 units, those renting for $400–599 declined by 1.8 million units, and those renting for $600–799 declined by 1.5 million. On the other hand, the number of units renting for $800–999 increased slightly over the period, by about 198,000 units. But that’s solely due to a one-year bump in 2015. The number of units at this rent level has declined for three consecutive years since, totaling 127,000 fewer units.
While roughly flat nationally, losses at these modestly higher rent levels were concentrated in higher cost states, where units renting for $800 or more per month could be considered low-rent. From 2014–2018, the number of units that rented for $800-999 declined in 15 states, but with large decreases in California (237,000 units), Florida (88,000 units), New Jersey (63,000 units), and Washington (60,000 units). By contrast, the loss of even lower-cost units has been more widespread, with the decline in units renting for under $400 occurring in 45 states, the decline in units renting for $400–599 occurring in 50 states, and the decline in units renting for $600–799 occurring in 34 states.
Meanwhile, the number of higher-cost units has surged through new construction, upward filtering, and rising rents. In 2014–2018, the number of units renting for at least $1,000 was up 4.6 million, pushing the supply of such units to 19.4 million overall and their share from 33 percent to 43 percent of the total rental stock (Figure 2). In absolute terms, the increase occurred in 48 states, with the exceptions—Alaska and Wyoming—being small states with largely rural populations.
Figure 2: Strong Growth in High-Cost Rentals Has Coincided with Dramatic Declines in Low-Cost Units

Notes: Rental units may be occupied, vacant for rent, or rented but unoccupied; excludes units occupied without cash rent. Dollar values are adjusted for inflation using the CPI-U for All Items Less Shelter. Contract rent excludes all utilities paid separately.
Source: JCHS tabulations of US Census Bureau, American Community Survey 1-Year Estimates via IPUMS USA.
The decline in low-cost rental units has several potential causes. Some units were lost to the stock entirely, through demolition or conversion to other uses while others were sold to and occupied by homeowners. Still other units remained part of the rental stock but were simply rented at higher price points. Commonly thought of as upward filtering, this condition might be more pervasive when rental markets are tight. Moreover, supply constraints have made it difficult to build housing that replaces the low-cost stock directly without deep and costly subsidies. Whatever the cause, the effect has been clear: rental housing has become more expensive, significantly denting the supply of low-cost units, by whatever definition, in a short period of time.
It’s impossible to say what will happen to the stock of low-cost rental units in the wake of the COVID-19 pandemic and broader economic downturn. While rental demand will likely soften at the higher-end of the market, there’s no guarantee that relief will come to the low-cost housing stock. In the short-term, the pandemic might even exacerbate the already-constrained supply, as lower mobility rates limit the number of low-cost options for renters. As the 2018 ACS data show, demand for low-cost units was already high while their availability was extremely low. Additional tightening at the low end of the market could pose significant affordability challenges to low- and middle-income renters.