
The Rent Eats First: Most Renters Can’t Afford a Comfortable Standard of Living
The rental housing affordability crisis that existed even before COVID-19 has left millions of households burdened by rent with little income left over for other needs. In a new working paper, Alex Hermann, Sophia Wedeen, and I estimated the number of renter households who have “residual-income burdens,” meaning they don’t have enough income to meet a modest but comfortable standard of living after paying rent. We found that 62 percent (19.2 million) of working-age renter households couldn’t afford this standard of living.
To figure out how much income households need, we used data from the Economic Policy Institute’s (EPI) Family Budget Calculator. EPI estimates expenses by county for households with up to two adults and up to four children. The expenditure categories include housing, transportation, health care, food, childcare, taxes, and other necessities. We modified some of these estimates to account for the actual housing costs and ages of household members reported in 2018 American Community Survey data, the most recent year available when we conducted the analysis.
For each household in our ACS sample (renters with no household members age 65 or older), we subtracted their monthly rent and utilities from their income to calculate a residual income. We classified households whose residual income was lower than their estimated spending needs as having residual-income housing cost burdens. This differs from the standard method of identifying housing cost burdens, which simply considers households to be burdened if they spend more than 30 percent of income on rent and utilities. The benefit of the residual income method is that it considers all the other expenses that households have beyond housing and can capture a wider range of renters who struggle with the high cost of living.
An astounding 19.2 million households in our sample of 30.9 million renters (62 percent) couldn’t afford a comfortable standard of living after paying rent, a number that has likely worsened since the pandemic. This is also much higher than the 48 percent of working-age renters in our sample who were cost burdened based on the traditional 30 percent measure. Most households were burdened under both measures, but residual-income cost burdens were notably higher for households with children and middle-income renters (Figure 1).
Figure 1: Residual-Income Cost Burdens Are Much Higher Than the Standard Measure for Middle-Income Renters
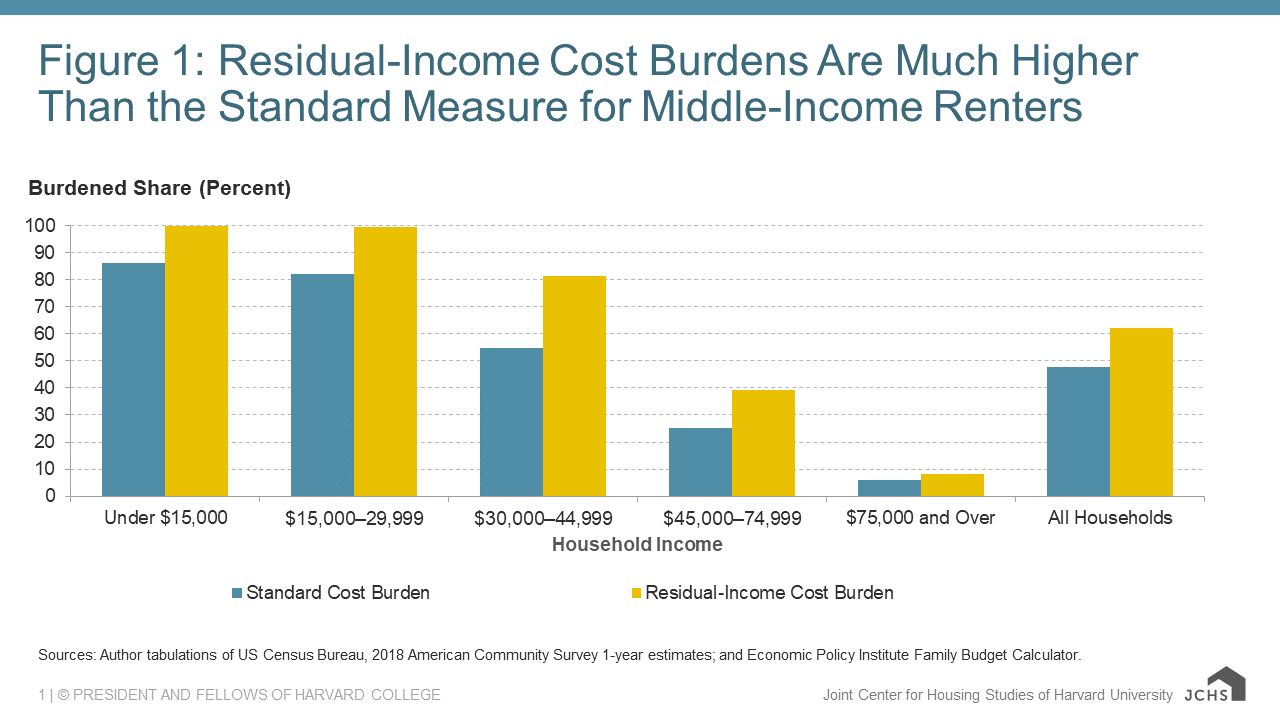
Sources: Author tabulations of US Census Bureau, 2018 American Community Survey 1-year estimates; and Economic Policy Institute Family Budget Calculator.
The standard cost burden approach implies that there are two possible interventions: reducing housing costs or increasing household incomes. The residual-income approach offers several points of intervention, including decreasing any of the expenditure categories through different policy levers. To see which subsidies would reduce residual-income burdens the most, we recalculated expenses and burdens for several possible policies.
We found that each intervention by itself would help reduce burdens only at the margins and only for middle- to higher-income households (Table 1). Universal housing vouchers, for example, would result in a drop of 521,000 renter households with residual-income burdens. The burden rate would fall by a modest 2 percentage points to 60 percent, and household deficits would drop by $4,000 on average. Of the policies we explored, a combined housing and transportation subsidy would have the largest impact.
Table 1: Effect of Policy Interventions on Residual-Income Cost Burdens
| Share (Percent) and Number (in Millions) of Households with Residual-Income Cost Burdens | ||||||||||||
|---|---|---|---|---|---|---|---|---|---|---|---|---|
| Existing | With Policy Intervention | |||||||||||
| Affordable Housing | Affordable Housing and Transportation | Half Healthcare Subsidy | Half Food Subsidy | Full Childcare | ||||||||
| Share | # | Share | # | Share | # | Share | # | Share | # | Share | # | |
| Less than $15,000 | 100.0 | 5.7 | 100.0 | 5.7 | 100.0 | 5.7 | 100.0 | 5.7 | 100.0 | 5.7 | 100.0 | 5.7 |
| $15,000–29,999 | 99.5 | 5.7 | 99.5 | 5.7 | 91.3 | 5.3 | 98.7 | 5.7 | 99.0 | 5.7 | 99.5 | 5.7 |
| $30,000–44,999 | 81.3 | 4.4 | 77.4 | 4.2 | 57.7 | 3.1 | 71.3 | 3.9 | 74.5 | 4.1 | 80.3 | 4.4 |
| $45,000–74,999 | 39.1 | 2.7 | 35.2 | 2.5 | 30.2 | 2.1 | 30.4 | 2.1 | 32.3 | 2.3 | 33.4 | 2.3 |
| $75,000 or more | 8.3 | 0.6 | 7.8 | 0.5 | 7.8 | 0.5 | 5.5 | 0.4 | 5.1 | 0.4 | 3.3 | 0.2 |
| All working-age renter households | 62.1 | 19.2 | 60.4 | 18.7 | 54.2 | 16.8 | 57.6 | 17.8 | 58.5 | 18.1 | 59.5 | 18.4 |
Sources: Author tabulations of US Census Bureau, 2018 American Community Survey 1-year estimates; and Economic Policy Institute Family Budget Calculator.
The pre-pandemic housing affordability crisis in the US may have been even worse than traditional cost burden statistics indicate. The more than 19 million renter households with residual-income burdens were likely making significant tradeoffs in spending, housing quality, or location to make ends meet. The potential effects on the health and well-being of households, and especially the children in those households, are incalculable. Ultimately, housing unaffordability is only one part of the equation. A combination of policies or household income supports would be needed to substantially reduce burdens, particularly for the lowest-income households.