
The Record-Breaking Rental Market
There are always surprising and interesting data points that emerge as we work on our reports, but America’s Rental Housing 2022 was stunning in the sheer number of record-breaking conditions in the rental market. Here are seven facts from this year’s report that illustrate the unprecedented territory we’re currently in.
1. Rents climbed rapidly
Asking rents for professionally managed apartments skyrocketed in 2021. Rents dipped in the first year of the pandemic before resuming their rise at a pace of 1.7 percent year over year in the first quarter of 2021 (Figure 1). In the third quarter of 2021, though, rent growth hit an astounding 10.9 percent. This was the fastest rate of growth in CoStar’s 20-year data series. Higher-quality apartments led the way with rents rising 13.8 percent, but even the lower-quality segment, which did not see the same dip in rents, posted about a 4 percent increase in rents in the third quarter of last year. These rent hikes were also geographically widespread with more than half of the 150 markets that RealPage tracks hitting double-digit rent growth.
Figure 1: After a Brief Dip, Rents for Higher-Quality Apartments Soared in 2021
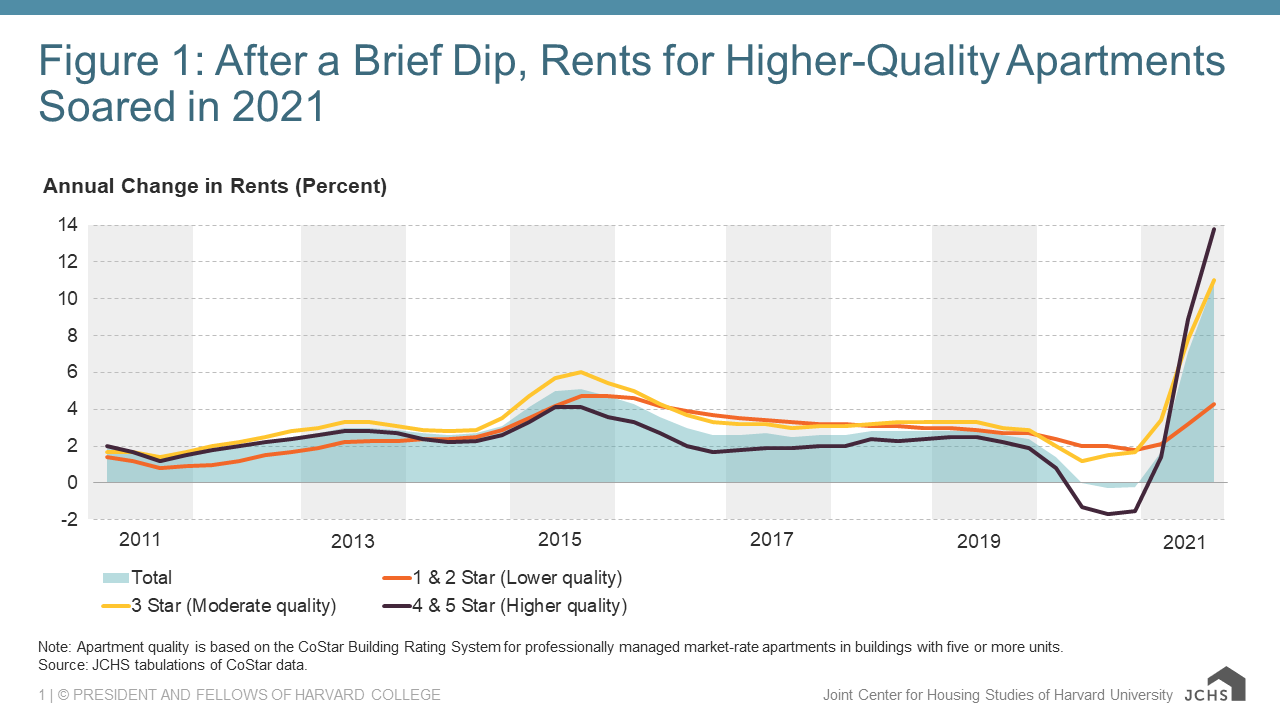
Note: Apartment quality is based on the CoStar Building Rating System for professionally managed market-rate apartments in buildings with five or more units. This figure is Figure 1 in America's Rental Housing 2022.
Source: JCHS tabulations of CoStar data.
2. Vacancy rates plummeted
According to data from the Housing Vacancy Survey (HVS), vacancy rates hit 5.8 percent in the third quarter of 2021, down from 6.6 percent in the first quarter of 2020. Aside from some mid-pandemic quarters with unreliable data, the third quarter vacancy rate was the lowest on record since the mid-1980s. This trend was also clear in the professionally managed apartment market. During the first year of the pandemic, the vacancy rate jumped a half percentage point to 6.9 percent (Figure 2). By the third quarter of 2021, the vacancy rate was down to just 4.6 percent, far below pre-pandemic levels and the lowest rate in data back to the early 2000s. The drop was especially steep in prime urban markets where the vacancy rate spiked at 9.7 percent before falling nearly 4 percentage points to 6.0 percent in the third quarter of 2021.
Figure 2: After a Sharp Rise, Vacancy Rates in Prime Urban Markets Plunged to Historic Lows
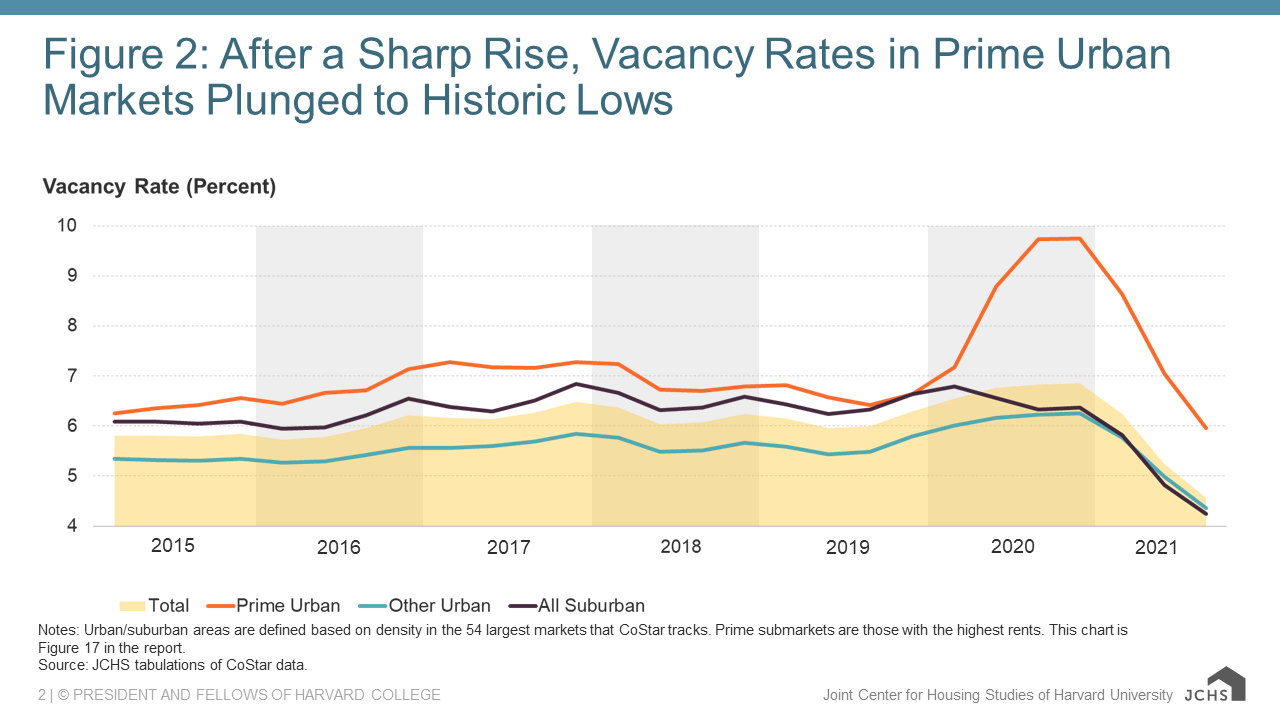
Notes: Urban/suburban areas are defined based on density in the 54 largest markets that CoStar tracks. Prime submarkets are those with the highest rents. This figure is Figure 17 in America's Rental Housing 2022.
Source: JCHS tabulations of CoStar data.
3. Rental demand surged
The number of renter households increased by more than 870,000 from the start of the pandemic to the third quarter of 2021, reaching a total of 44 million according to the HVS. The increasing number of renters was especially noteworthy given that it had remained at about 43 million for the previous four years. This jump in demand was echoed in the professionally managed market. According to RealPage data, the net increase in occupied apartments was more than 600,000 in the third quarter of 2021, a record jump in demand in data that goes back to the 1990s (Figure 3). Increased demand in the overall apartment market has come overwhelmingly from higher-income households, a trend that likely continued throughout the pandemic as skyrocketing home prices and low inventories put homeownership out of reach for many.
Figure 3: Rental Demand Far Outpaced Growth in New Supply in 2021
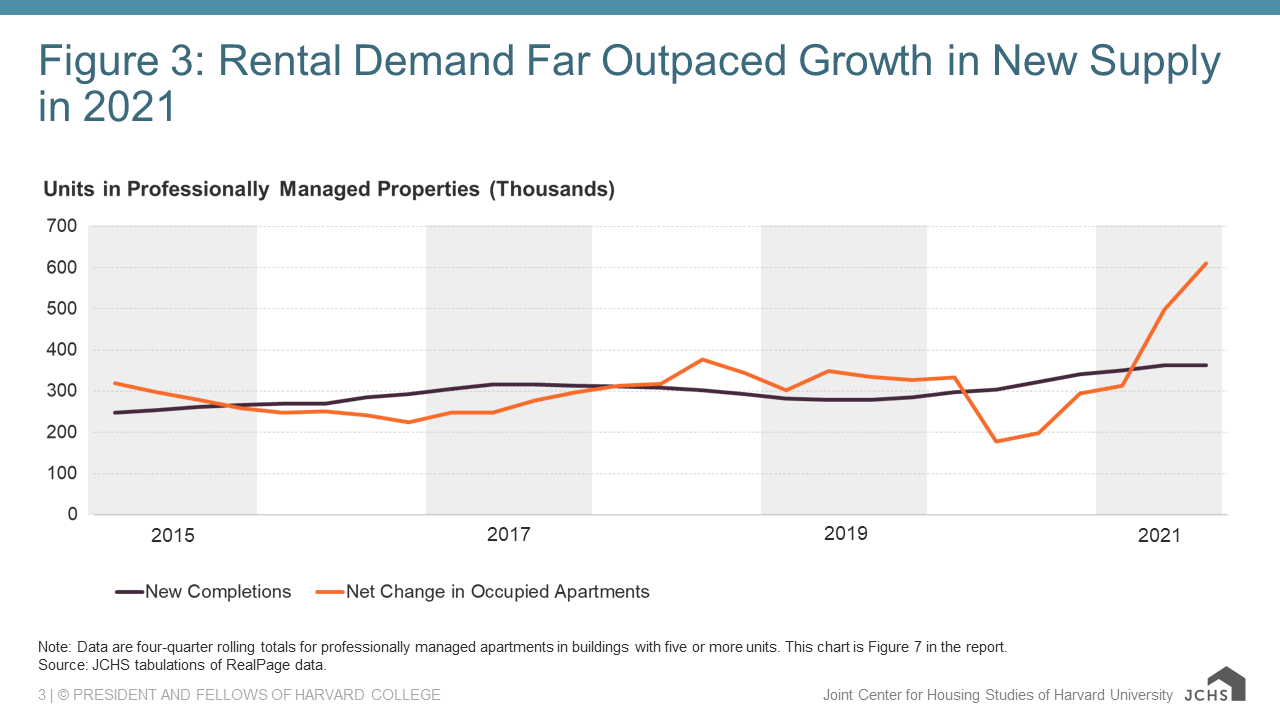
Note: Data are four-quarter rolling totals for professionally managed apartments in buildings with five or more units. This figure is Figure 7 in America's Rental Housing 2022.
Source: JCHS tabulations of RealPage data.
4. Multifamily construction boomed
Steady demand from higher-income households in recent years has fueled multifamily construction. Through November 2021, multifamily housing starts hit a three-decade high of 466,000 units at a seasonally adjusted annual rate (Figure 4). This was substantially higher than the 350,000 unit annual pace averaged from 2014–2020. Completions also reached their highest level since the 1980s at more than 375,000 multifamily units in 2020. Multifamily completions are likely to stay elevated as the supply under construction continues to grow. Even though construction is booming, new apartments are being leased at a faster pace with a 72 percent three-month absorption rate in the second quarter of 2021, up about 15 percentage points from the 2014–2021 average.
Figure 4: The Heated Pace of Multifamily Construction Is Adding Hundreds of Thousands of Units to the Rental Stock
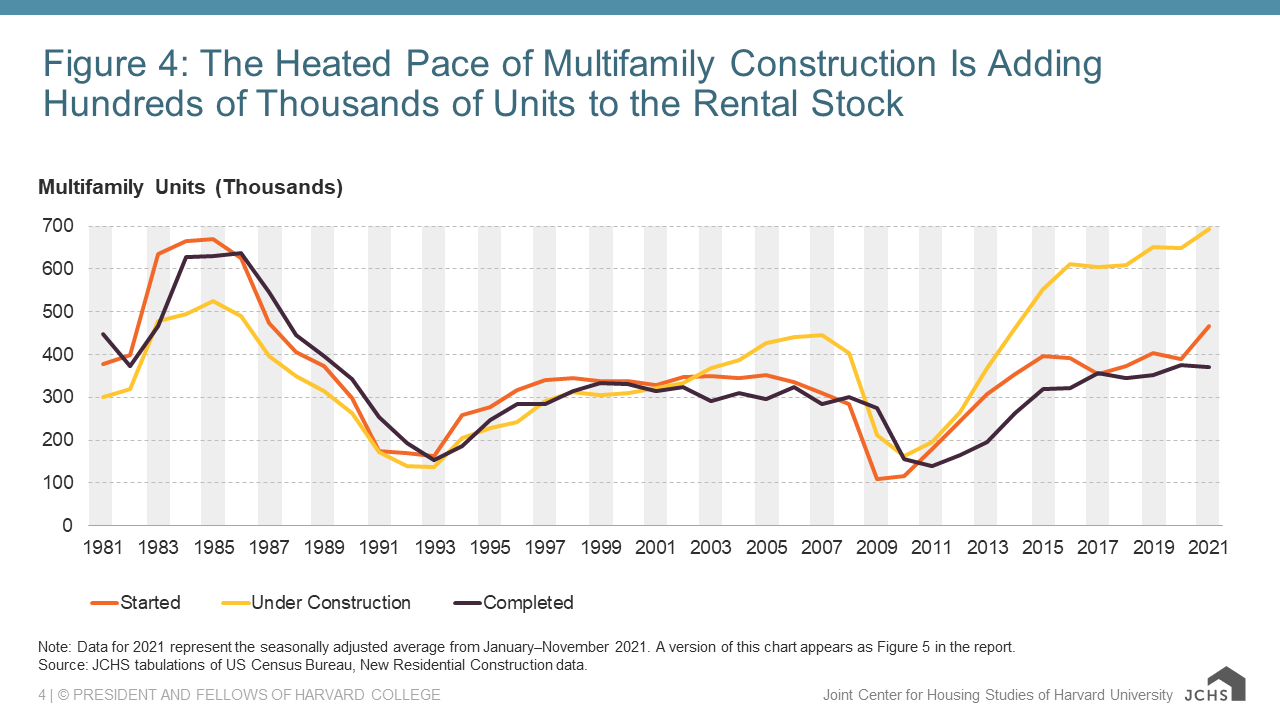
Note: Data for 2021 represent the seasonally adjusted average from January–November 2021. This figure is Figure 5 in America's Rental Housing 2022.
Source: JCHS tabulations of US Census Bureau, New Residential Construction data.
5. Apartment prices hit a new high
Rebounding demand has also pushed rental property prices ever higher. Price appreciation stayed in the low double-digits before the pandemic before dropping to about 7 percent in the fall of 2020. By October 2021, prices were rising again, this time at the rate of 16.8 percent year over year. This was the fastest property prices had grown in records back to the early 2000s and outpaced both retail (14.2 percent) and office (13.7 percent) price increases. At the same time, capitalization rates fell to a record low of 4.1 percent in the third quarter of 2021, reflecting strong investor optimism. Low mortgage interest rates, ready access to capital, and strong property performance have helped bolster investor demand for rental properties. With prices rising and investors eager to buy, multifamily mortgage debt outstanding climbed to $1.77 trillion in the third quarter of 2021.
6. The pandemic spurred unprecedented efforts to stabilize renters
Rising rents and income losses during the pandemic hit many renters hard. In the third quarter of 2021, 23 percent of renters had lost income in the previous four weeks and 15 percent were behind on rent. Despite this financial hit, evictions remained low throughout the pandemic. In a sample of six states and 31 cities tracked by The Eviction Lab, eviction filings were about 40 percent lower in November 2021 as compared to the averages from the same month in 2012–2016. Court closures and landlord flexibility likely explain some of the drop in eviction filings over the last two years, but unprecedented federal efforts to stabilize renters undoubtedly helped keep people in their homes (Figure 5). Eviction moratoriums were the first line of defense, beginning with the CARES Act moratorium in March 2020 that was targeted to renters living in properties with federally backed mortgages. The CDC then issued a hold on evictions that covered more renters in September 2020. A second CDC order in August 2021 covered renters experiencing hardships in areas with high COVID transmission. Two rounds of Emergency Rental Assistance totaling more than $46 billion also became available in 2021 to specifically support households behind on rent payments.
Figure 5: Federal Support Throughout the Pandemic Has Helped to Keep Renters in Their Homes
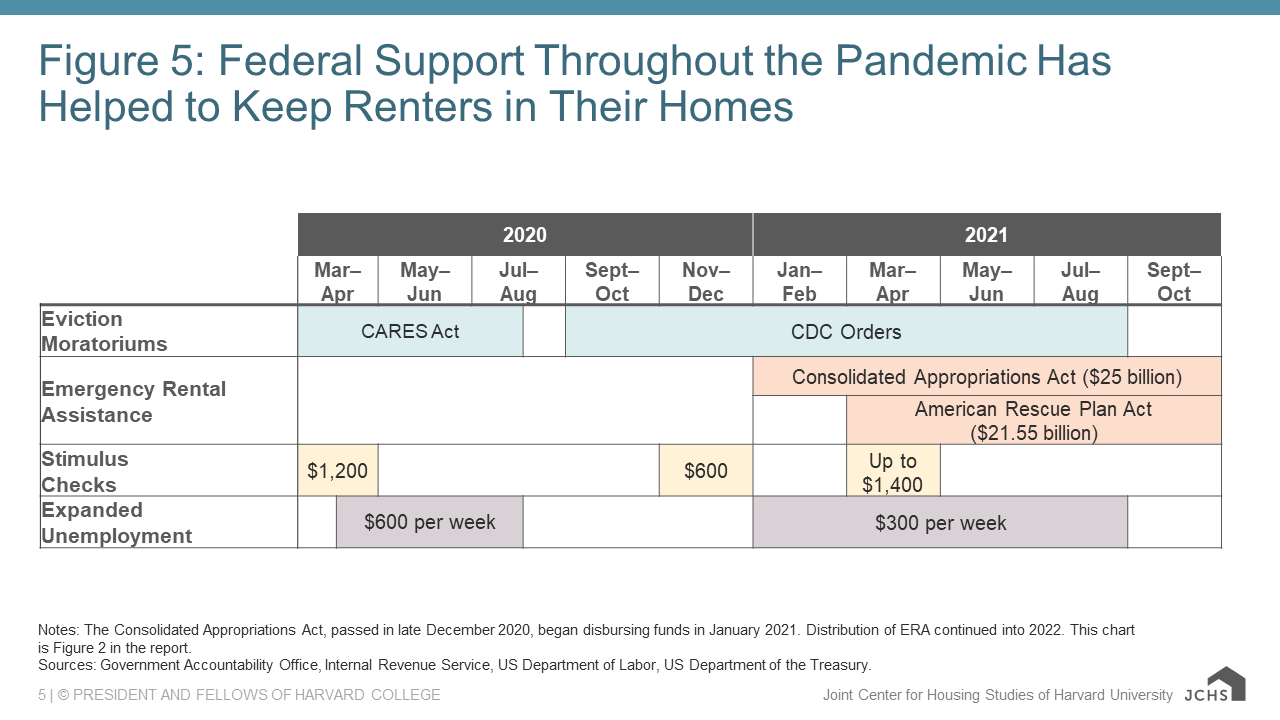
Notes: The Consolidated Appropriations Act, passed in late December 2020, began disbursing funds in January 2021. Distribution of ERA continued into 2022. This figure is Figure 2 in America's Rental Housing 2022.
Sources: Government Accountability Office, Internal Revenue Service, US Department of Labor, US Department of the Treasury.
7. Climate change posed an even greater threat
In the first nine months of 2021 alone, the National Oceanic and Atmospheric Administration (NOAA) reported 18 weather- and climate-related events that caused at least $1 billion in damage. The combined cost of these events reached nearly $105 billion, far above the average from the preceding four decades. These events threaten the nation’s rental stock and displace renters who have few resources to evacuate. In total, 17.6 million rental units–40 percent of the stock–are in areas with at least moderate expected annual losses, according to the latest FEMA data (Figure 6). This includes 4.0 million units with rents below $600, a stock that has already experienced significant losses since 2011. The effects of climate change and natural hazards also threaten millions of federally-subsidized apartments, and their loss or disrepair would only worsen the affordability crisis.
Figure 6: More Than 17 Million Rental Units Are Under Threat from Natural Disasters
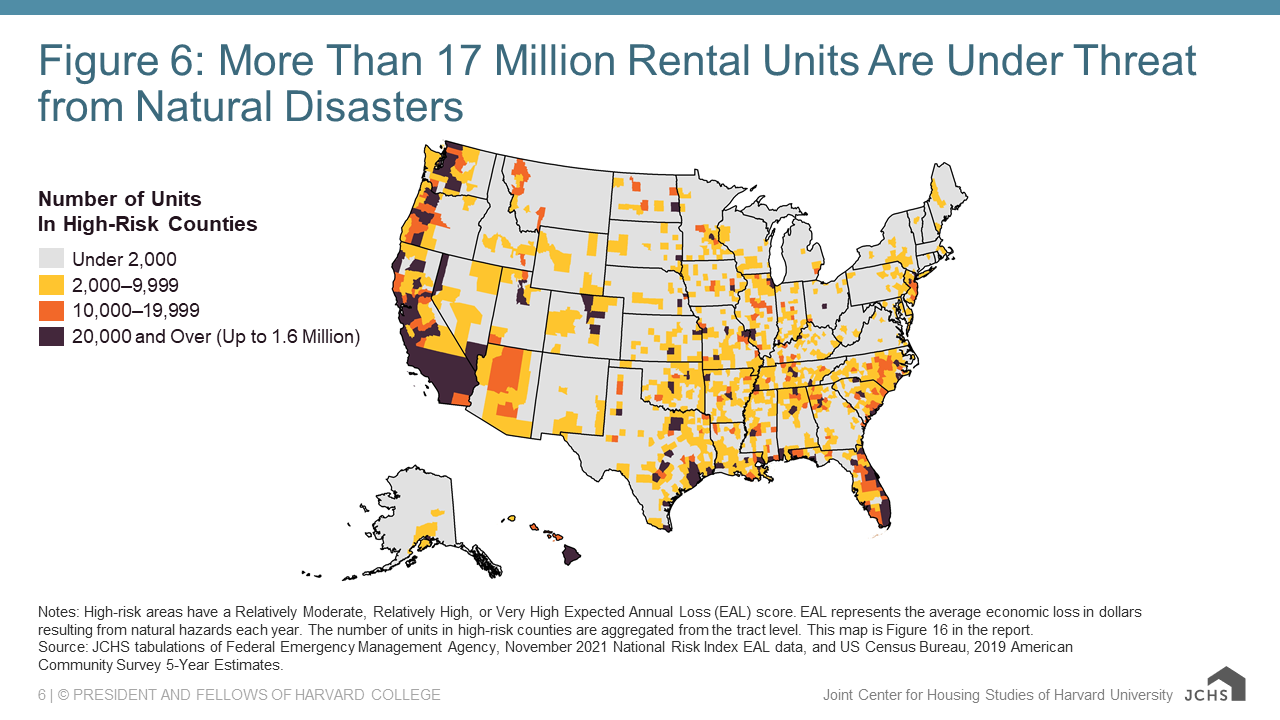
Notes: High-risk areas have a Relatively Moderate, Relatively High, or Very High Expected Annual Loss (EAL) score. EAL represents the average economic loss in dollars resulting from natural hazards each year. The number of units in high-risk counties are aggregated from the tract level. This figure is Figure 16 in America's Rental Housing 2022.
Source: JCHS tabulations of Federal Emergency Management Agency, November 2021 National Risk Index EAL data, and US Census Bureau, 2019 American Community Survey 5-Year Estimates.
Rising rents, fewer vacant units, reduced incomes, and climate events threaten the housing security of millions of struggling households. Although a series of federal interventions have helped mitigate these risks during the pandemic, bold, far-reaching measures to shore up the housing safety net and expand the affordable rental housing supply.