Past Recessions Might Offer Lessons on the Impact of COVID-19 on Housing Markets
The COVID-19 pandemic has shut down large swaths of the nation’s economy, affecting the day-to-day lives of millions of households. Housing markets, like nearly every sector of the economy, will not be spared. Demand for housing will likely soften as unemployment grows and household incomes decline. Moreover, thousands of homes have already been pulled off the market, affecting both potential buyers and sellers. Fewer housing units will also be produced in the short-term, possibly impacting housing affordability over the long run.
But what we know to date is preliminary, as key housing market indicators – on housing construction, sales, prices, inventory, and more – begin to trickle out. On a seasonally adjusted annual basis, for example, new housing starts declined 22 percent in March from the prior month. While such monthly data is volatile and susceptible to future revisions, this is the largest one-month decline since the mid-1980s. Likewise, new home sales declined 15 percent last month. Unfortunately, we won’t know the full picture of COVID-19’s effect on housing markets until long after the virus is contained. But to get a sense of where the market could be headed, and what might be in store during the eventual recovery, we can consider both historical and global contexts to gain important insights.
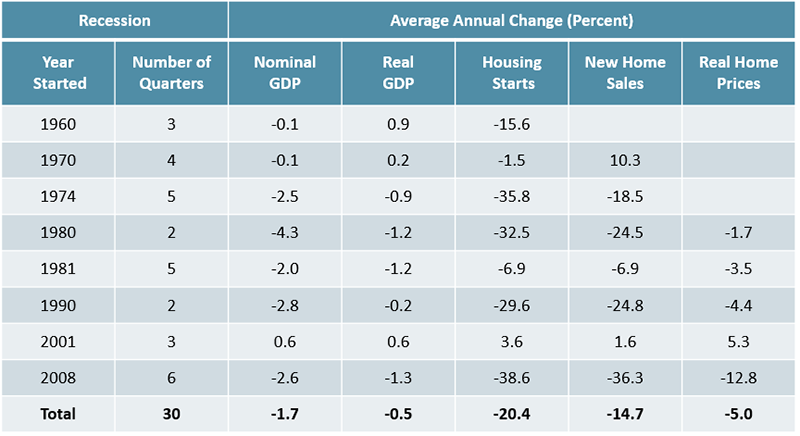
According to our tabulations of data from the National Bureau of Economic Research, there have been eight recessions since 1960. From peak to trough, these recessions have lasted nearly four quarters on average. The longest, during the Great Recession, lasted six quarters. Declines in housing production and new home sales occurred in all prior recessions. In data going back to 1960, year-over-year housing starts fell by an average of 20 percent in quarters with a recession (Figure 1). In data going back to 1970, new home sales declined 15 percent on average during recessions. Likewise, in recessions since 1980, real home prices declined 5 percent year-over-year, on average, with annual declines in all but one recession (the recession beginning in 2001).
Figure 1: In Recessions, Housing Starts and Home Sales, Important Drivers of Economic Growth, Decline Substantially
Notes: Home prices are adjusted for inflation using the CPI for All Items Less Shelter. Recessions are calculated from peak to trough.
Source: JCHS tabulations of US Census Bureau, New Residential Construction and New Residential Sales data; National Bureau of Economic Research, US Business Cycle Expansions and Contractions; Freddie Mac, House Price Index; US Bureau of Economic Analysis, National Income and Product Accounts.
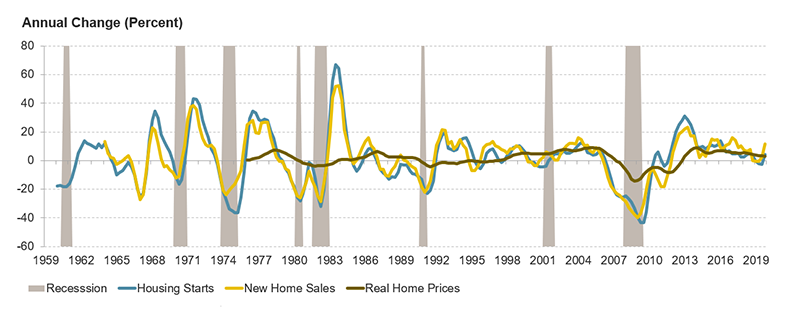
The magnitude of these changes has varied considerably. During the Great Recession, for example, quarterly housing starts were down as much as 43 percent year-over-year in one quarter, home sales dropped 40 percent, and real home prices fell by 14 percent (Figure 2). In contrast, home sales actually rose steadily during quarters with a recession in 2001. During that period, real home prices never fell and annual housing starts declined as much as 5 percent early in the recession before rebounding quickly, averaging nearly 4 percent growth.
Figure 2: Housing Market Activity Decreases Before and During Recessions
Notes: Housing starts, home sales, and home price data are four-quarter trailing averages. Home prices are adjusted for inflation using the CPI for All Items Less Shelter. Recessions are calculated from peak to trough.
Source: JCHS tabulations of US Census Bureau, New Residential Construction and New Residential Sales data; National Bureau of Economic Research, US Business Cycle Expansions and Contractions; Freddie Mac, House Price Index.
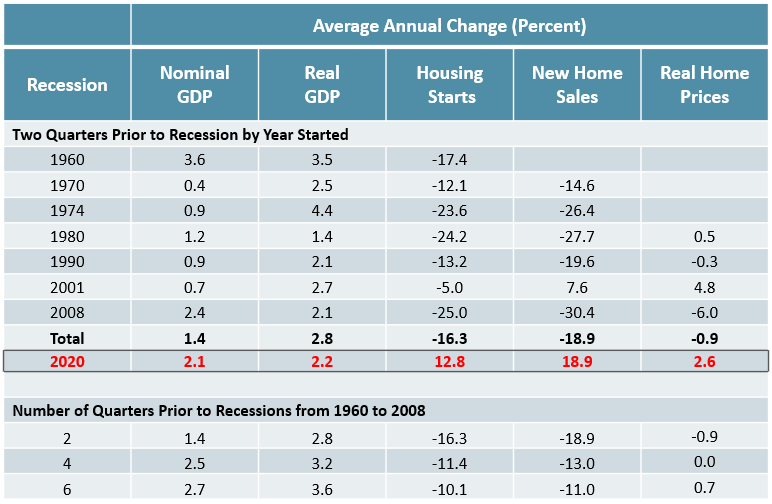
Unlike the current downturn, housing production usually softened before previous recessions even began. Indeed, housing is often thought of as a leading indicator of economic activity. In the two quarters prior to the last eight recessions, housing starts were down 16 percent on average from the prior year, while new home sales declined 19 percent (Figure 3). All the while, gross domestic product (GDP) – both real and nominal – continued to grow. Looking at each recession individually since 1960, housing starts were already declining on average in the two quarters prior to each recession, up to a 25 percent decline preceding 2008. Likewise, new home sales over this period decreased before all but one recession (2001), including between 15 percent prior to 1970 and 30 percent prior to 2008. Declines in both measures were common going back at least six quarters prior to recessions.
Figure 3: Housing Starts and Home Sales Decline in the Quarters Leading up to Recessions Even as GDP Rises
Notes: Home prices are adjusted for inflation using the CPI for All Items Less Shelter. Recessions are calculated from peak to trough. Quarters prior to the recession in 1981 are not shown. There are only two quarters of annual changes in housing starts prior to 1960. The recession in 2020 assumes a start in the first quarter, and this is the average annual change in the last two quarter of 2019. Changes prior to all recessions do not include data from the assumed 2020 recession.
Source: JCHS tabulations of US Census Bureau, New Residential Construction and New Residential Sales data; National Bureau of Economic Research, US Business Cycle Expansions and Contractions; Freddie Mac, House Price Index; US Bureau of Economic Analysis, National Income and Product Accounts.
Illustrating the unprecedented suddenness of the current slowdown, housing production was picking up before the pandemic hit the US. Housing starts and home sales were at cycle highs late last year, reaching their highest points since the mid-2000s. Indeed, over the past two quarters, housing starts climbed 13 percent on average while new home sales increased 19 percent. With respect to these housing market indicators, the current downturn most closely resembles the recession in 2001, when declines in housing market activity weren’t nearly so severe. Before 2001 housing starts declined just 5 percent and new home sales actually increased 8 percent on average in the preceding two quarters. The resulting downturn wasn’t especially long or severe, with GDP, housing starts, and home sales all chugging along modestly (on average) even during the downturn.
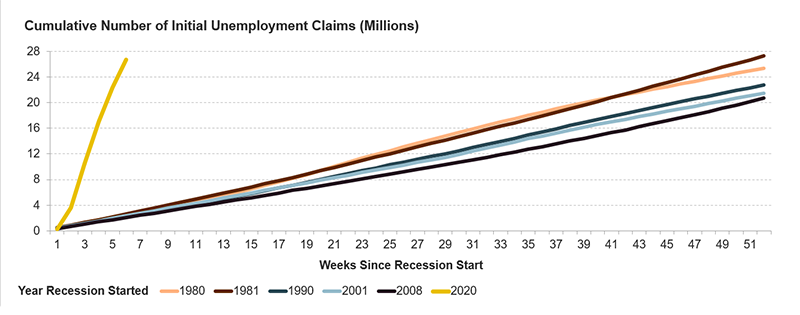
Despite some similarities to 2001, however, the economic slowdown this year is unlike any recent US recession. Over the past six weeks, nearly 27 million initial unemployment claims have been filed across the country. By contrast, it took exactly 52 weeks to reach that number of claims following the recession in 1981 (Figure 4). It took over a year in all other recessions over the past four decades, including 63 weeks in the aftermath of the 2008 recession. In any case, the pace of job losses in the US is unprecedented in the post-war era. The closest parallels are likely other global pandemics. According to an analysis from Zillow, following the SARS outbreak in Hong Kong in February 2003, home sales fell 33 percent below projected levels by May. However, transactions (as well as unemployment) recovered to normal by July of the same year, when the virus had largely been contained. But that return to relative normalcy depended largely on containment of the virus.
Figure 4: Initial Unemployment Claims Rose More Rapidly in Early 2020 than During the Past Five US Recessions
Notes: Initial unemployment claims are seasonally adjusted. No recession has officially been declared for 2020. Data for 2020 show the cumulative number of claims over a six-week period beginning March 8th.
Source: JCHS tabulations of US Bureau of Labor Statistics, Unemployment Insurance Weekly Claims Report; National Bureau of Economic Research, US Business Cycle Expansions and Contractions.
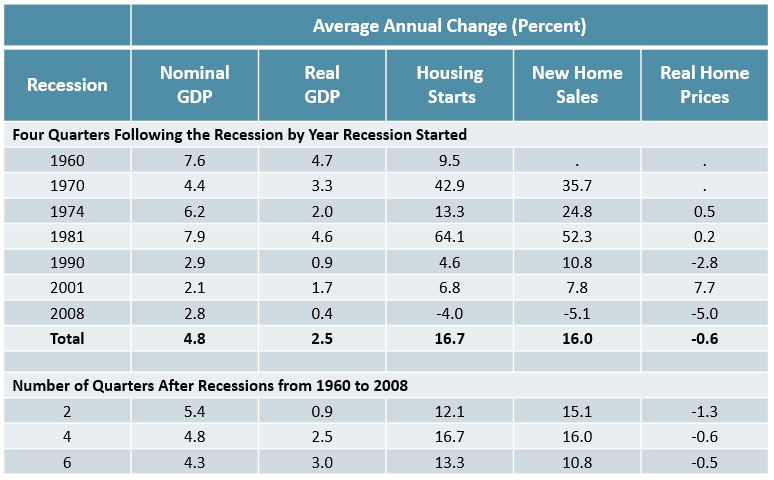
While it’s too soon to gauge the extent and duration of the current downturn, much less what’s in store for the eventual recovery, housing production has been a significant source of economic growth during prior recoveries. In the first two quarters of recoveries following the past eight recessions, nominal GDP growth increased 5 percent while real GDP growth averaged 1 percent. Over the same period, housing starts increased 12 percent on average year-over-year and new home sales were up 15 percent (Figure 5). After four quarters, housing market activity was even more robust, up 17 percent annually for starts and 16 percent for sales. The only notable exception in the past half-century was the recovery following the 2008 recession. After the Great Recession, housing production stalled for years, due largely to the high levels of homebuilding preceding the crash, the corresponding financial crisis, and the severity and length of the recession.
Figure 5: Housing Starts and Home Sales Typically Help Jumpstart the Recovery in the Quarters Following Recessions
Notes: Home prices are adjusted for inflation using the CPI for All Items Less Shelter. Recessions are calculated from peak to trough. Quarters after the recession in 1980 are not shown.
Source: JCHS tabulations of US Census Bureau, New Residential Construction and New Residential Sales data; National Bureau of Economic Research, US Business Cycle Expansions and Contractions; Freddie Mac, House Price Index; US Bureau of Economic Analysis, National Income and Product Accounts.
While history suggests that housing activity has helped bolster economic growth following past recessions, the unprecedented nature of the current crisis and the uncertainty of the public health response make such projections impossible. But prior recessions still provide a benchmark for understanding what could happen to housing markets during the present downturn and point to what’s possible in the eventual recovery. Both will depend largely on how well COVID-19 can be contained and its effects on the broader economy addressed.


