
Pandemic May Start a Slowdown in Household Growth – Halting Immigration Would Slow Things Even More
The COVID-19 pandemic, which hit during a resurgence of household formations in the US, could usher in a long-lasting slowdown in household growth that was becoming evident even before the crisis.
Entering 2020, household growth was at its highest level since before the Great Recession. The Census Bureau’s Housing Vacancy Survey showed the number of US households increased by 1.4 million in 2019, while the slightly older 2018 American Community Survey also reported growth of 1.46 million. Both surveys show levels of growth well above the 1.2 million per year average we projected for 2018-2028 based on underlying demographics.
Markets were finally receiving the long-awaited pent-up demand for households from young adults who had put off living independently in favor of living with parents or roommates. Driven by low unemployment and rapid income growth, young adults in their 20s and 30s were forming households at increasing rates at last measure in 2018. As a result, headship rates (shares of people heading independent households) increased among these age groups for the first time since the mid-2000s.
There were signs over the past year, however, that household growth was about to slow. According to Census Bureau estimates, growth in the US population slowed to a near crawl in 2019, increasing by just 0.48 percent, which the Brookings Institution observed to be the “lowest annual growth rate since 1918.” The 1.55 million annual population growth recorded in 2019 was a more rapid slowing than last projected by Census, which was for gains of 2.3 million per year that would continue until 2030 (Figure 1).
Figure 1: Latest Census Estimates Show US Population Growth Is Slowing More Quickly than Projected
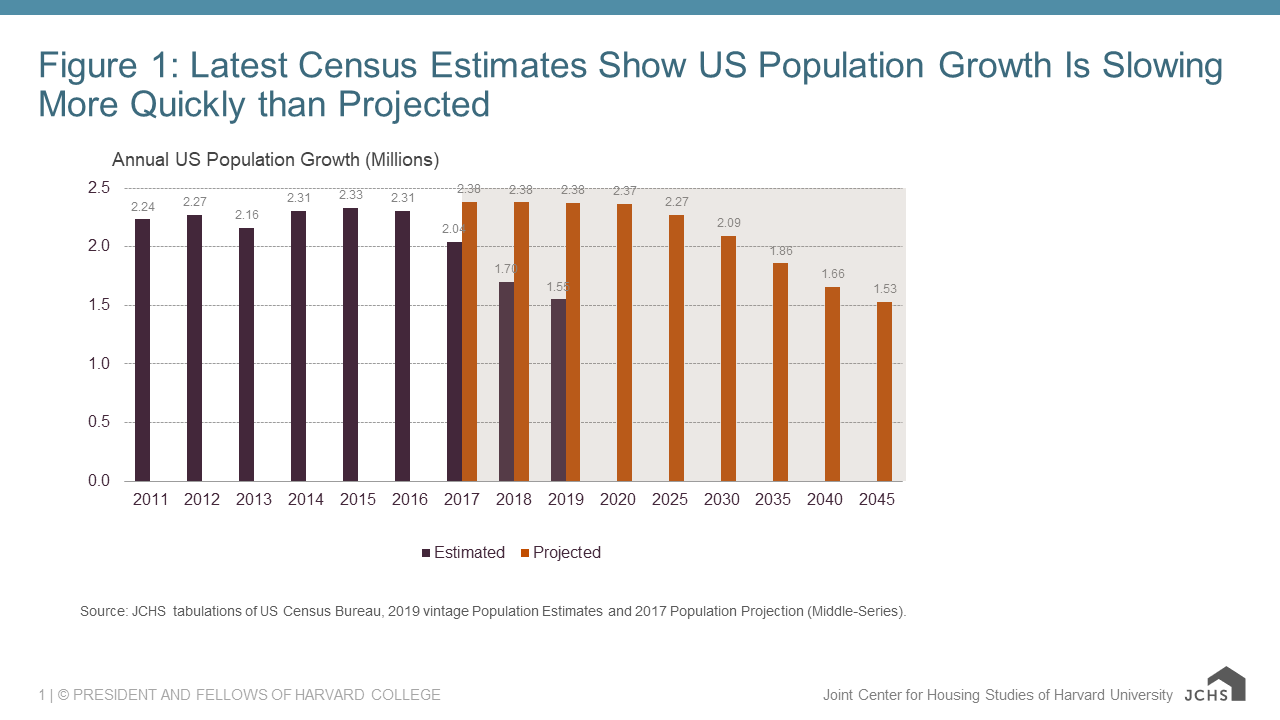
Source: JCHS tabulations of US Census Bureau, 2019 vintage Population Estimates and 2017 Population Projection (Middle-Series).
The slowdown in population growth in 2019 was driven by sizable downturns in both of its key components: net international immigration and natural growth (the combination of births and deaths of the resident population). Net international immigration plummeted in 2019. The Census Bureau estimated that population gains from net international immigration dropped 15 percent in 2019 to just 595,000 people, pushing levels 43 percent below the 1.05 million net gains from immigration in 2016 (Figure 2).
Figure 2: Net International Immigration Has Dropped to Levels Well Below Those Projected
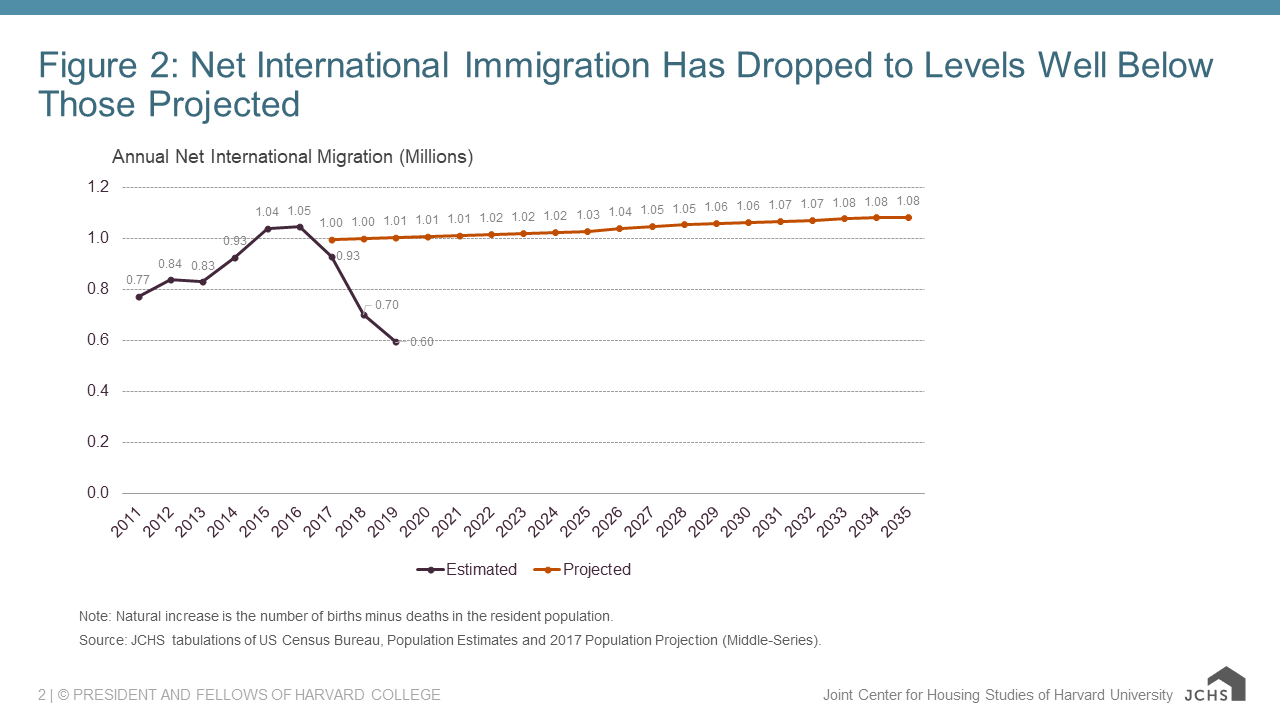
Note: Natural increase is the number of births minus deaths in the resident population.
Source: JCHS tabulations of US Census Bureau, Population Estimates and 2017 Population Projection (Middle-Series).
Immigration is a highly volatile source of population growth that is sensitive to economic, political, and other factors in both the US and abroad, so wide swings over a few years are relatively common. Birth and death rates, however, change slowly. Therefore, the most notable part of the current population estimates was the decline in natural growth of the resident population. Driven by both a decline in the number of births and a rise in the number of deaths, natural growth of the population dropped below 1 million for the first time in decades according to the Census Bureau. This was surprising because the most recent Census projections, which were released in 2017, indicated that natural growth would not drop below 1.0 million until 2030 (Figure 3).
Figure 3: Fewer Births and More Deaths Have Already Slowed Natural Population Increases to Levels Not Projected Until the 2030s
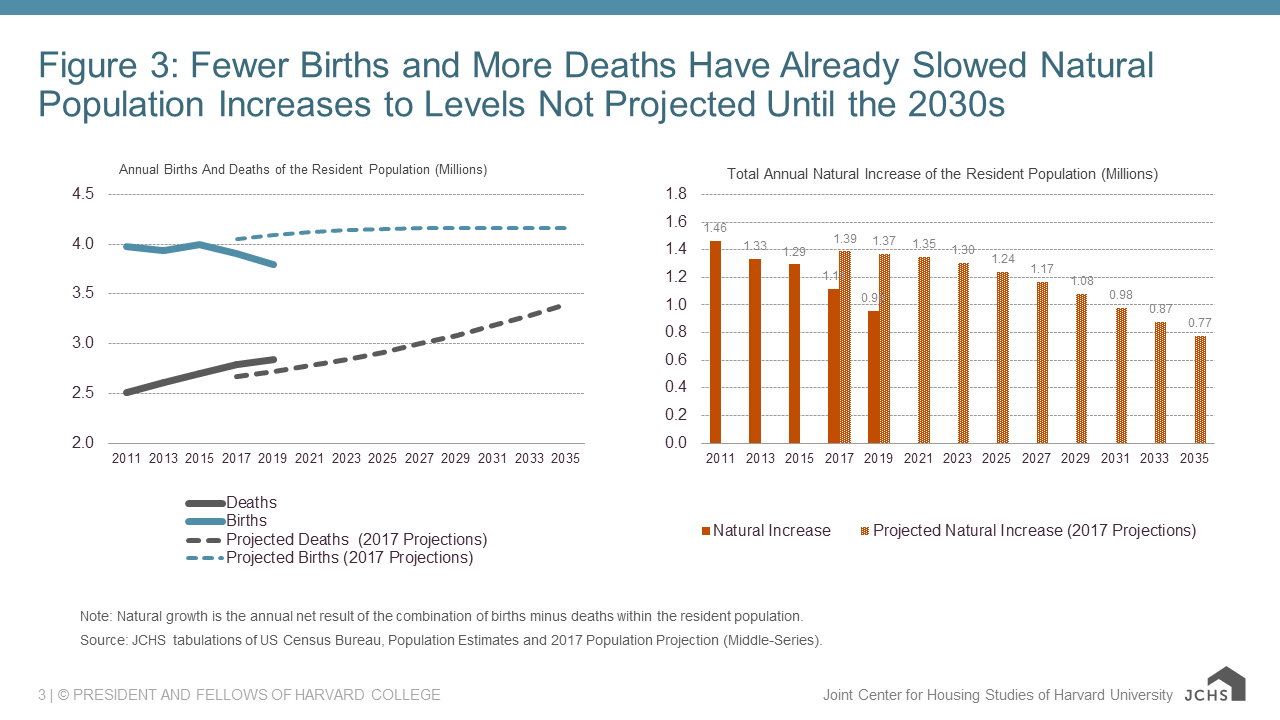
Note: Natural growth is the annual net result of the combination of births minus deaths within the resident population.
Source: JCHS tabulations of US Census Bureau, Population Estimates and 2017 Population Projection (Middle-Series).
Several recent studies have outlined possible reasons behind for the recent slowing of population growth. Declines in life expectancy and rises in age-adjusted death rates, linked with sharp increases in drug overdose deaths, have occurred alongside declines in births and birth rates, which have been attributed to trends of delayed childbearing and sharp reductions in teenage birth rates.
Slower population growth is likely to lead to fewer households than we projected in 2018. Our estimates, which were based on the Census population projections from 2017, projected household growth to slow from 1.2 million per year in 2018-2028 to 0.96 million per year in 2028-2038 (Figure 4). Less natural growth of the resident population and increased reliance upon immigration, which can be more variable, will also likely result in future household growth levels that are not only lower, but less predictable.
Figure 4: Household Growth Is Projected to Slow with Population Growth
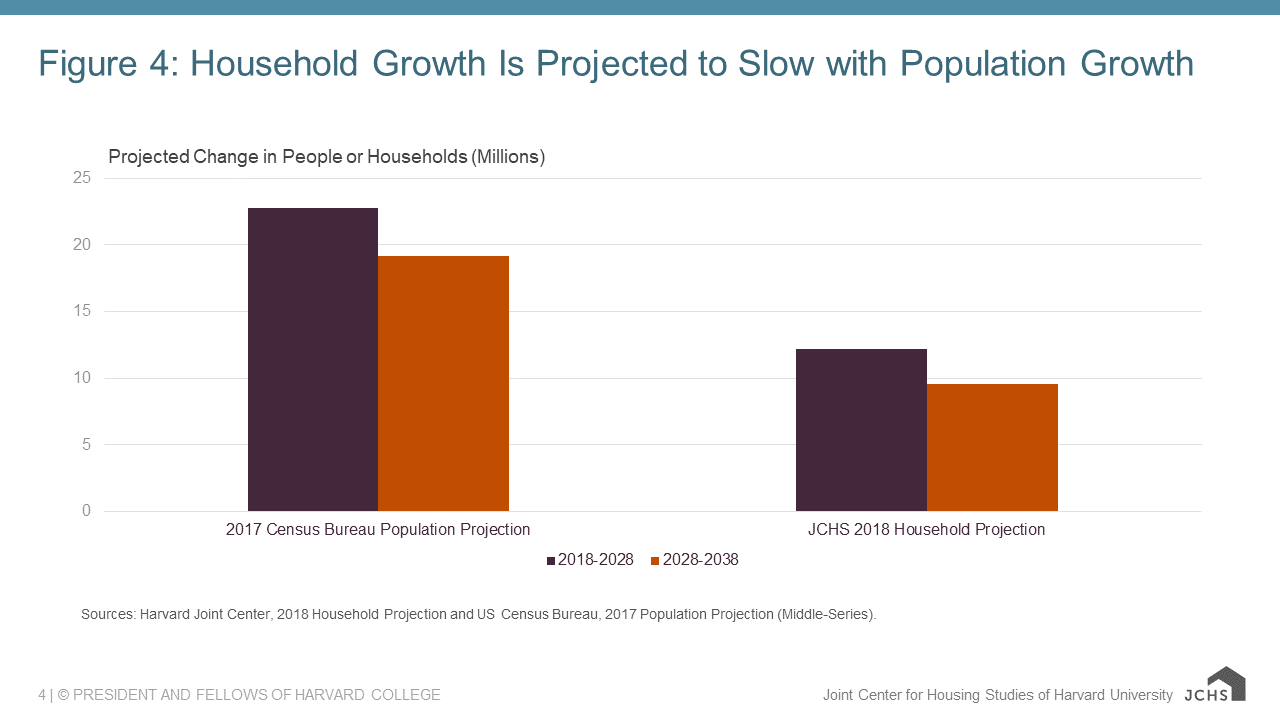
Sources: Harvard Joint Center, 2018 Household Projection and US Census Bureau, 2017 Population Projection (Middle-Series).
Over the next year, the pandemic is almost certain to produce additional declines in population growth that will lower household growth for the year. Immigration will likely drop from an already very low annual level in 2019 (particularly if the recently announced suspension of immigration moves forward), while it also seems likely there will be more deaths in 2020 than in the recent past, when there have been about 2.8 million deaths a year. Additionally, with the economy at a standstill for much of the year, fewer young adults are likely to form households.
It is also possible that the drops in population and household growth may be short-lived, or even followed by a rebound if immigration levels bounce back and delayed young-adult household formations reappear to provide a short-term boost to household growth after this crisis recedes.
Ultimately, however, any projections of a post-pandemic recovery in household growth should take into account the fact that, even before the pandemic, the underlying trends were suggesting we are on the cusp of a long-term slowdown in household growth. Halting immigration, which has been responsible for 40 percent of all household growth in the US since 2000, would add to the decline. This means that when the crisis ends, we may not return to household growth levels as high as those recorded over the past few years.