
Number of U.S. Households Projected to Increase by 12.2 Million in the Next Decade
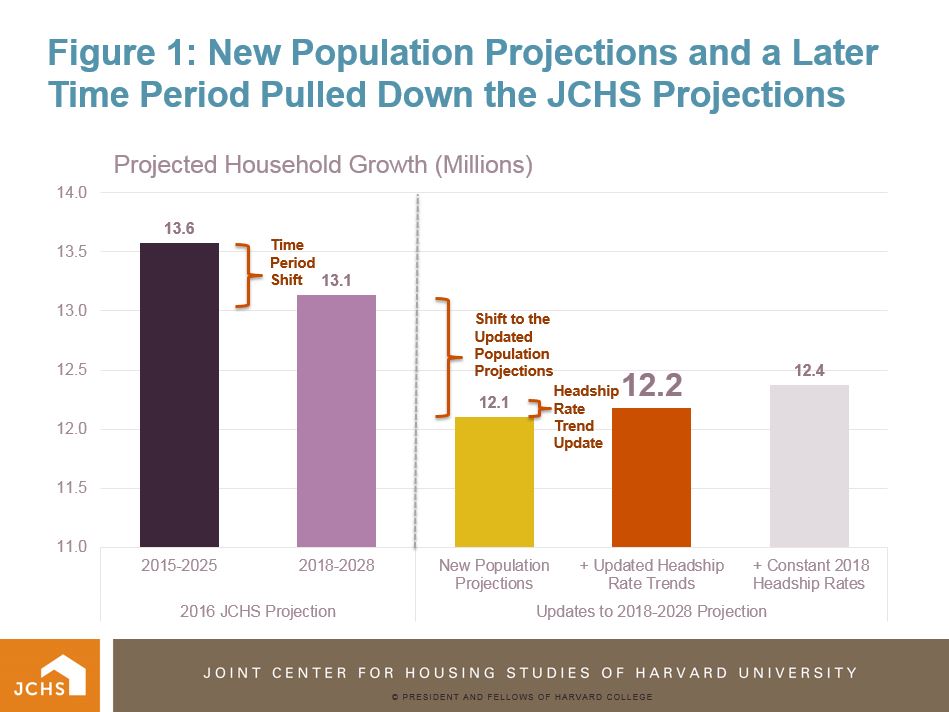
According to our new projections, the number of households in the US will grow by 12.2 million between 2018 and 2028 and then 9.6 million between 2028 and 2038. These projections, detailed in a new working paper, are lower than our 2016 projections, which had called for growth of 13.6 million for 2015-2025 and 11.0 million for 2025-2035. The characteristics of household growth remain largely unchanged, however, and the new projections still call for significant growth in the number of older-adult, minority, and millennial households, and for single-person households, empty-nesters, and married-couples with children to lead growth among household types. The analysis also finds that even after a sizable downward revision, underlying demand for new housing in 2018-2028 remains well above current production levels, suggesting additional room for expansion.
As the working paper describes, the main reason the new household projections are lower than the 2016 projections is the lower population projection released by the Census Bureau in 2017, which assumed much less future immigration and slightly higher mortality rates for the native born than their previous projection. However, the three-year shift in the projection period (from 2015-2025 to 2018-2028) also made a surprisingly large difference in lowering growth, underscoring the sharpness of the decline in population growth expected to occur after 2025 once the baby boom generation reaches the oldest age groups and drives up the overall mortality rate. Meanwhile, updating headship rate trends with three additional years of new data had little impact (Figure 1).
Figure 1: New Population Projections and a Later Time Period Pulled Down the JCHS Household Projections
Although the new projections call for less household growth overall, they follow previous projections in calling for significant growth in older-adult and minority households. Specifically, between 2018 and 2028, the number of households headed by a person age 65 and over is projected to grow by 11.2 million, or roughly 34 percent (Figure 2). Meanwhile, the number of minority households (headed by a person who is not non-Hispanic white) is projected to grow by 9.3 million, or about 22 percent over ten years. After 2028, growth is projected to slow, shift to even older age groups, and include a higher minority share.
Figure 2: The Number of Older Households is Projected to Grow Significantly Over the Next Two Decades
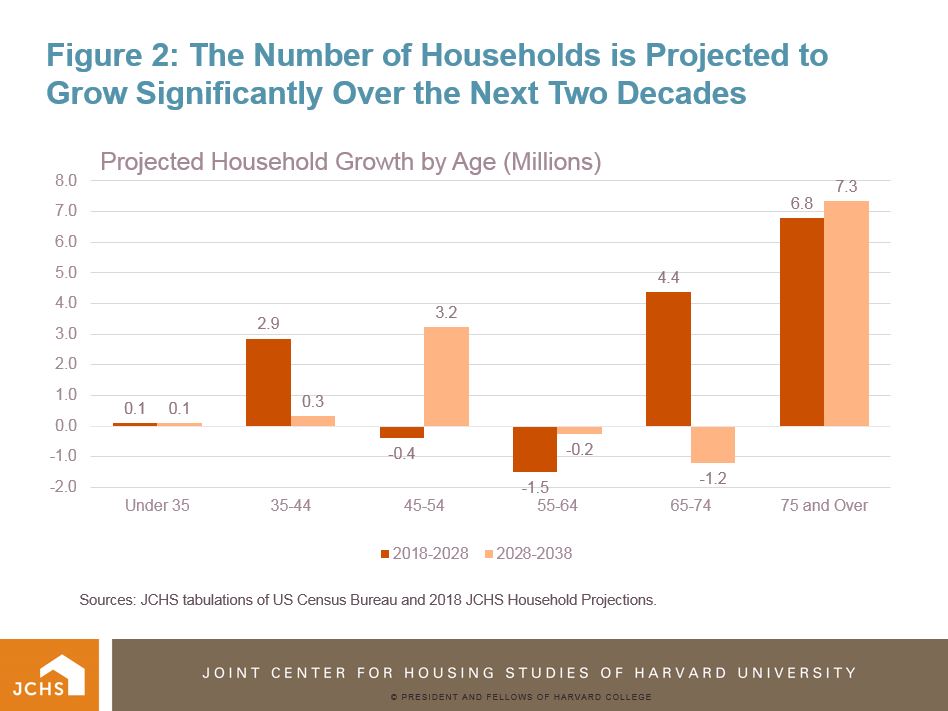
Sources: JCHS tabulations of US Census Bureau and 2018 JCHS Household Projections.
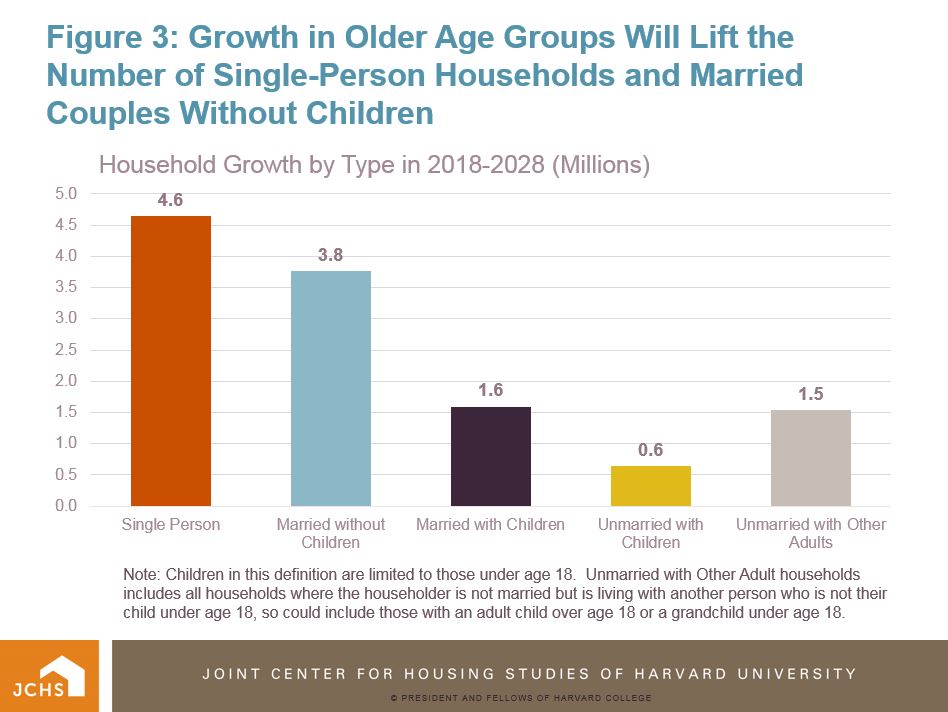
The new projections also follow previous projections in calling for single-person households and married couples without children – household types most common to older adults – to lead growth among household types (Figure 3). They also project a rebound in the number of married-couple households as the large millennial generation moves into peak child-rearing ages.
Figure 3: Growth in Older Age Groups Will Lift the Number of Single-Person Households and Married Couples Without Children
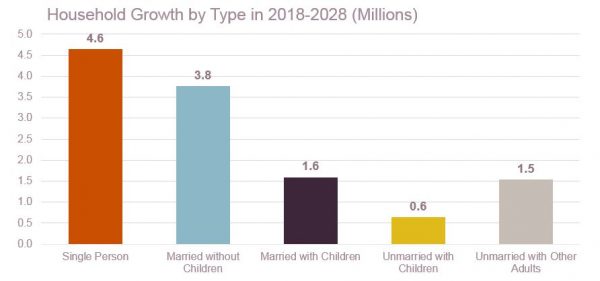
Note: Children in this definition are limited to those under age 18. Unmarried with Other Adult households includes all households where the householder is not married but is living with another person who is not their child under age 18, so could include those with an adult child over age 18 or a grandchild under age 18.
Given that household growth is a fundamental driver of demand for additional housing units, the working paper concludes with updated estimates for baseline demand for new housing for 2018-2028. The new estimates, which also include updated assumptions for the other major components of new housing demand (such as for second homes and replacement of teardowns and conversions to non-housing uses), show baseline demand for 15.1 million new housing units in 2018-2028, which is a reduction from the previous projection that called for 16.9 million for 2015-2025. The majority of this 1.8 million decline in total projected new housing demand is due to the 1.4 million decline in expected household growth (Figure 4). The lesser remaining amount is split roughly evenly between lower demand for additional seasonal/vacant units and lower estimates for replacement of teardowns and conversions.
Figure 4: Baseline Demand for Additional Housing Units: 2018-2028 (Thousands of Housing Units)
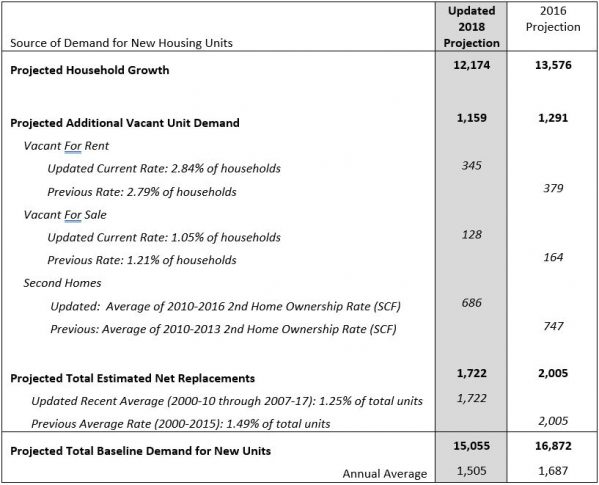
Source: JCHS 2018 Household Projections
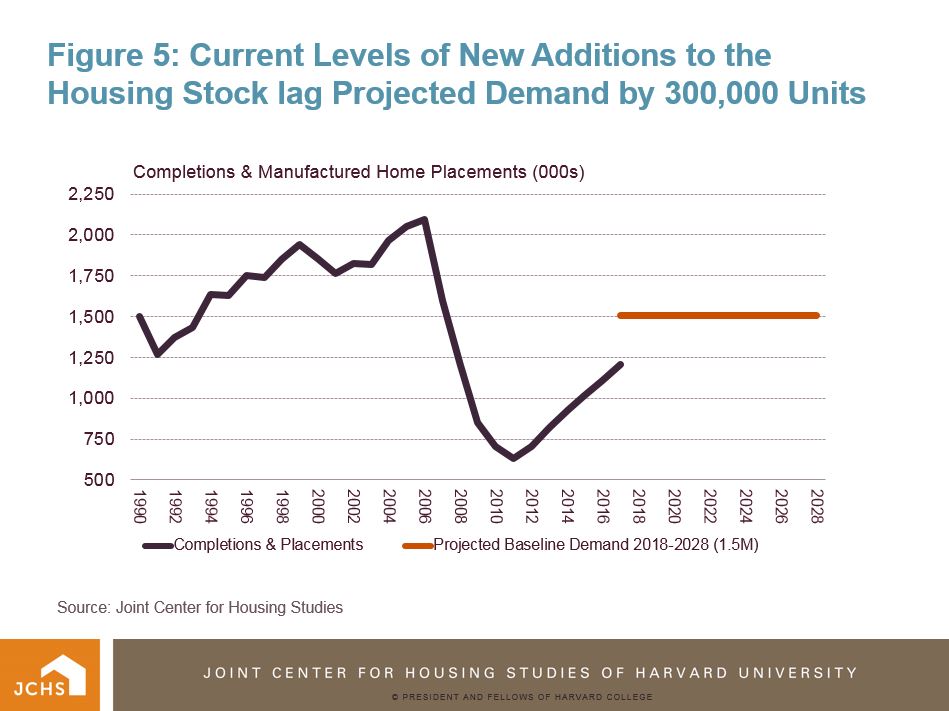
Even after the sizeable downward revision, the new estimates show baseline demand for additional housing units in 2018-2028 still exceeds recent production levels. Given the approximately 1.2 million completions and mobile home placements in 2017, the new demand estimates suggest recent housing production levels are approximately 300,000 units per year below average annual levels underlying demand would support in 2018-2028 (Figure 5). As baseline demand estimates, however, these figures contain several assumptions about the current and future states of housing markets that could affect actual production levels that occur.
Figure 5: Current Levels of New Additions to the Housing Stock Lag Projected Demand by 300,000 Units
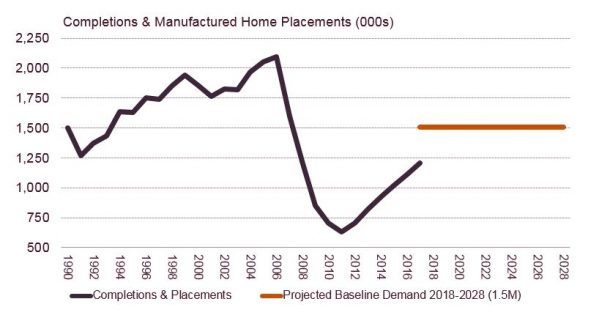
Source: Joint Center for Housing Studies
For much more on the new projections including an updated projections dataset, see the full working paper.