
New Paper Details the Dramatic Decline of Low-Cost Rentals
A significant decline in low-cost rental units over the past three decades has exacerbated housing affordability pressures faced by low-income renters, according to a new working paper I co-authored with Elizabeth La Jeunesse, Daniel McCue, and Jonathan Spader.
Although the overall rental stock grew by 10.9 million units between 1990 and 2017, the number of units renting for less than $600 per month (in constant 2017 dollars) fell by nearly 4.0 million (Figure 1). The data also show that this decline was concentrated in the last five years. After falling modestly in the 1990s and early 2000s, the stock of low-cost units rose in the aftermath of the recession. Since 2012, however, the number of units renting for under $600 has fallen sharply, accounting for a large share of the decline in low-cost units over the long run.
Figure 1: Evidence of a Major Decline in US Supply of Low-Cost Rental Units Since 1990
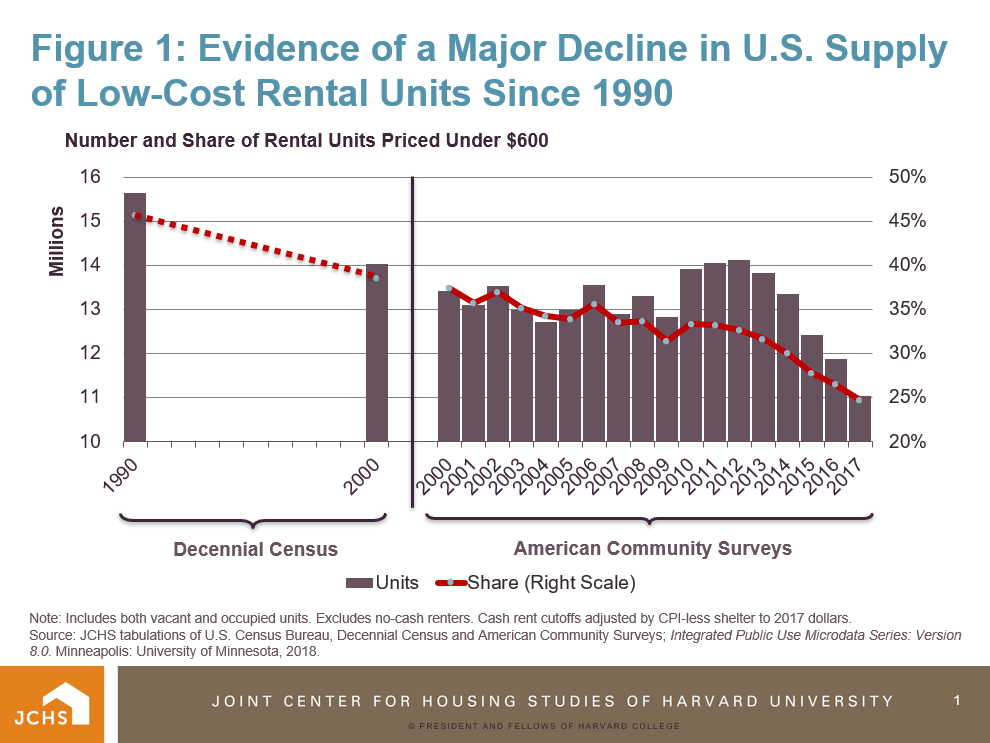
Note: Includes both vacant and occupied units. Excludes no-cash renters. Cash rent cutoffs adjusted by CPI-less shelter to 2017 dollars.
Source: JCHS tabulations of US Census Bureau, Decennial Census and American Community Surveys; Integrated Public Use Microdata Series: Version 8.0. Minneapolis: University of Minnesota, 2018.
In the paper, we used US Census Bureau data—both Decennial Censuses and 1-Year American Community Surveys—to document the long-run decrease in low-cost rentals, discuss the geographic distribution of these declines, and explore the connections between the loss of low-cost units and the increased number of cost-burdened low-income renters. Key findings include:
- The magnitude of decline in low-rent units varies according to how you define “low-rent.” For the US as a whole, the largest decline—totaling 4.0 million units between 1990 and 2017—occurred among units renting for less than $600 per month. However, the decline in low-cost units was significant under alternative definitions. For example, during the same time, homes renting for under $400 declined by 2.3 million units nationwide. Moreover, the number of units renting for under $800 per month declined by 2.1 million, a smaller sum given the growth in units renting for between $600 and $799.
- The drop in low-cost units was especially steep over the past five years. From 2012 to 2017, the number of units renting for under $600 decreased by 3 million units, nearly twice the 1.7 million unit loss that occurred between 1990 and 2000.
- The loss of low-cost rental units was widespread. Between 1990 and 2017, the number of units renting for less than $600 declined in 47 states and the District of Columbia, while the share of units renting for less than $600 declined in all 50 states plus Washington DC. In absolute terms, declines were greatest in Texas, where the number of units renting for less than $600 declined by nearly 720,000. In contrast, in the three states where the number of units increased—Connecticut, South Carolina, and Arkansas—the growth was more modest, ranging from 8,000 to 10,000 units.
- The size, rent level, and timing of losses differed by state. In many higher-cost states, the share of units renting for under $600 was already relatively low in 1990. However, as the interactive figure below shows, there were sharp declines in the number of units renting for less than $800 or $1000 per month in those states. For example, while the number of units renting for under $600 in California declined by 204,000, the number of units renting for less than $1,000 fell by 413,000 units (Figure 2).
Figure 2:
The paper concludes with a brief look at the extent to which declines in low-cost units coincided with the growth in low-income renters with cost burdens, meaning they spent more than 30 percent of their income on housing. By this calculation, housing is affordable at $600 per month to households earning at least $24,000. However, from 1990 to 2017, the share of cost-burdened households earning less than $24,000 increased from 76 percent to 82 percent nationwide. Moreover, the largest increases generally occurred in states with the greatest declines in low-cost units.