
Naturally Occurring Retirement Communities Score Lower on Livability
Naturally occurring retirement communities (NORCs) are neighborhoods where older adults make up a large share of the population, but which were not specifically designed or planned to meet the needs of older adults. In a recent report co-authored with the AARP Public Policy Institute, we found that, in about 6 percent of the nation’s approximately 211,000 Census block groups, at least half the population is 55 or over. These places, we noted, tended to score lower on AARP’s Livability Index than neighborhoods with greater age diversity.
NORCs can form when older adults are attracted to a desirable destination. Unsurprisingly, then, NORCs are slightly more concentrated in the South and West. Within these regions, NORCs are particularly common in metros in Florida, Arizona, and Oregon (Figure 1). NORCs can also form when younger adults move away and the population ages. Indeed, about 8 percent of all Census block groups are outside of metropolitan or micropolitan areas, but 13 percent of all NORCs are located in these rural communities. The share of rural block groups that are NORCs are especially high in New Hampshire, Oregon, and Washington.
Figure 1: Naturally Occurring Retirement Communities Are Common in Metros in Florida, Arizona, and Oregon
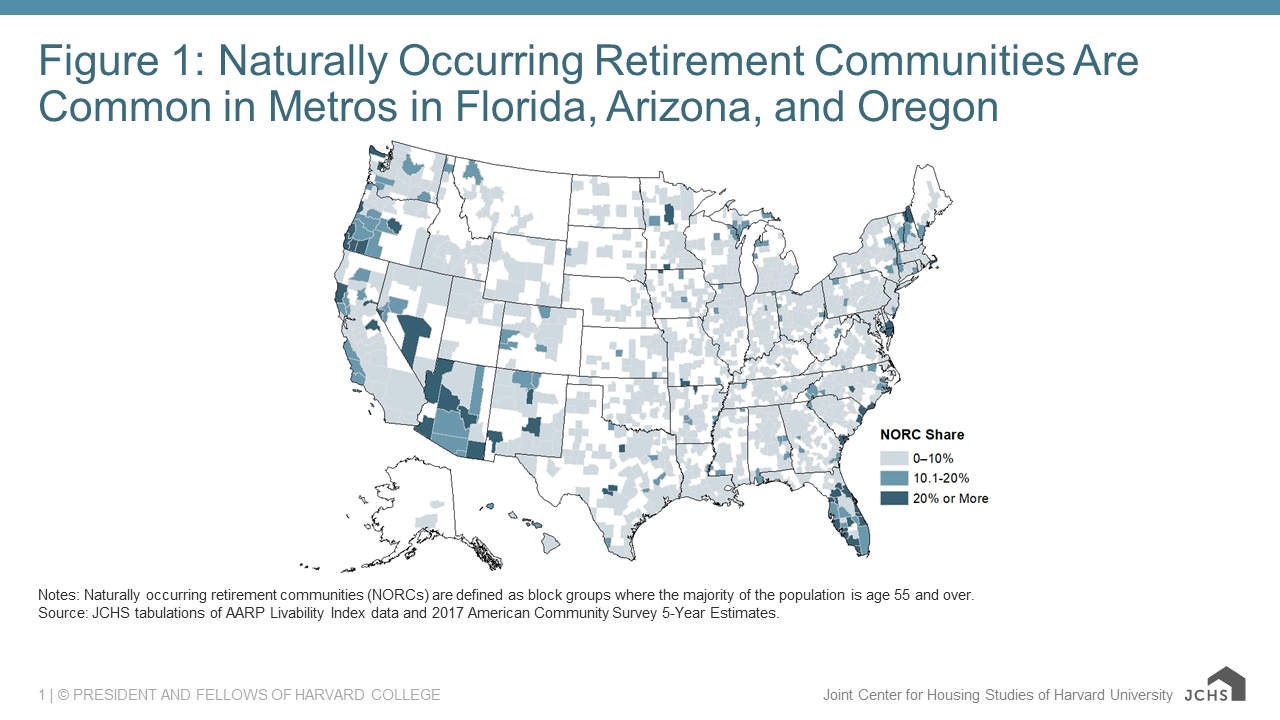
Notes: Naturally occurring retirement communities (NORCs) are defined as block groups where the majority of the population is age 55 and over.
Source: JCHS tabulations of AARP Livability Index data and 2017 American Community Survey 5-Year Estimates.
NORCs differ from other communities in a variety of ways. Given that a majority of the people in NORCS is older, the population is much less racially diverse. On average, 82 percent of NORC populations are non-Hispanic white, compared to just 62 percent in all other neighborhoods. The large older adult population also means that NORCs have a larger share of single-person households at 37 percent on average, while single people make up 27 percent of the households in other neighborhoods. Even with smaller households and fewer people in the work force, median household incomes in NORCs are about $61,000 on average, only slightly lower than the $63,500 in other neighborhoods.
Older adults tend to have higher homeownership rates than younger households, and the homeownership rate in NORCs (76 percent) is much higher than in other communities (63 percent). A larger share of manufactured housing in NORCs may support this homeownership rate, particularly in lower-density and non-metro locations. Yet, while single-family and manufactured housing dominate the housing stock in most NORCs, multifamily buildings with at least 50 units also make up a larger share of the housing stock, likely driven by NORCs, in more urban settings. The housing stock in NORCs is also newer, in part due to their location in the South and West. While nearly half of the housing in other communities was built before 1970, just over a third of the housing in NORCs is of the same vintage.
With high shares of older adults, it’s plausible that NORCs might have greater support for incorporating livability features to enable aging in place in the community. However, using the AARP Livability Index, we found that these communities tend to score low on livability. Looking at livability quintiles, just 9 percent of NORCs are in the most livable quintile while 36 percent are in the lowest quintile. The average Livability Index score in NORCs (48.6) is about three points lower than that of other communities (51.4).
The components of the Livability Index point out the strengths of NORCs as well as areas where improvements are needed. NORCs tend to score highest on engagement, environment, and housing, and have slightly better scores than other communities in these three areas (Figure 2). Opportunity scores are much lower in NORCs, though, at just 36.4. Opportunity includes measures of income inequality, high school graduation rates, jobs per worker, and age diversity, variables that would be significantly influenced by the presence of older adults but perhaps also indicate fewer employment prospects to attract younger residents. While opportunity certainly pulls down the overall score, NORCs also tend to have lower neighborhood scores, meaning that these communities likely do not feature compact or mixed-use development with proximity to parks, libraries, and grocery stores.
Figure 2: On Average, NORCs Score Lower on Neighborhood Amenities and Opportunity

Notes: Averages are for all block groups in each community type. Naturally occurring retirement communities (NORCs) are defined as block groups where the majority of the population is age 55 and over.
Source: JCHS tabulations of AARP Livability Index data and 2017 American Community Survey 5-Year Estimates.
Neighborhoods with high concentrations of older adults can make it easier to provide supports and services, offering some economies of scale to providers. And certainly many people seek out such places to enjoy the company of their peers. Yet our analysis points to gaps in features and amenities that could enhance older adults’ lives and enable them to remain longer in their homes and communities. For example, even in lower-density locations there are opportunities to enhance walkability, build more mixed uses in village centers, consider transportation alternatives to the private car, and create opportunities for connections across generations. Focusing on jobs and education is critical, too, in attracting and retaining younger residents who provide many of the supports and services older adults need. The Livability Index offers communities insight at a finer geography about what is needed to improve livability for all ages.