
As Low-Cost Units Become Increasingly Scarce, Low- and Moderate-Income Renters Are Losing Access to Many Neighborhoods
According to the Center’s recently released report, America’s Rental Housing 2022, the loss of low-cost rental units is making it increasingly difficult for low- and moderate- income renters to find affordable housing. Whether due to rising rents, conversions out of the rental stock, or outright demolition, the report tells us that the number of units renting for less than $600 fell by 3.9 million between 2011 and 2019. As the interactive map below shows, declines occurred in every state (Figure 1). While $600 may sound like an unrealistically low rent to some, based on the standard 30 percent of income metric it is the maximum affordable rent level for a household making $24,000 per year or less, which covers nearly 30 percent of all renter households (12.7 million households).
Figure 1: Every State Has Lost Low-Rent Units Since 2011
The growing shortage of low-cost units is making it increasingly difficult for low-income renters to find an affordable unit anywhere, let alone in a desirable neighborhood. To get a sense of the growing geographic constraints to low-income renters made worse by the loss of low-cost rentals, we looked at how many neighborhoods in each county are affordable to a typical renter in 2019 and compared that to what it was in 2000. Specifically, we identified the share of census tracts within each county that had a median rent of no more than 30 percent of the respective countywide median renter income in 2000 and then again in 2019.
We found that, in 2000, households with the median renter income for their county could afford the median rent in 72 percent of all tracts in their county. By 2019, however, that share had dropped to just 41 percent. In other words, on average across the nation the typical renter could only afford typical rents in less than half (41 percent) of the neighborhoods in their county.
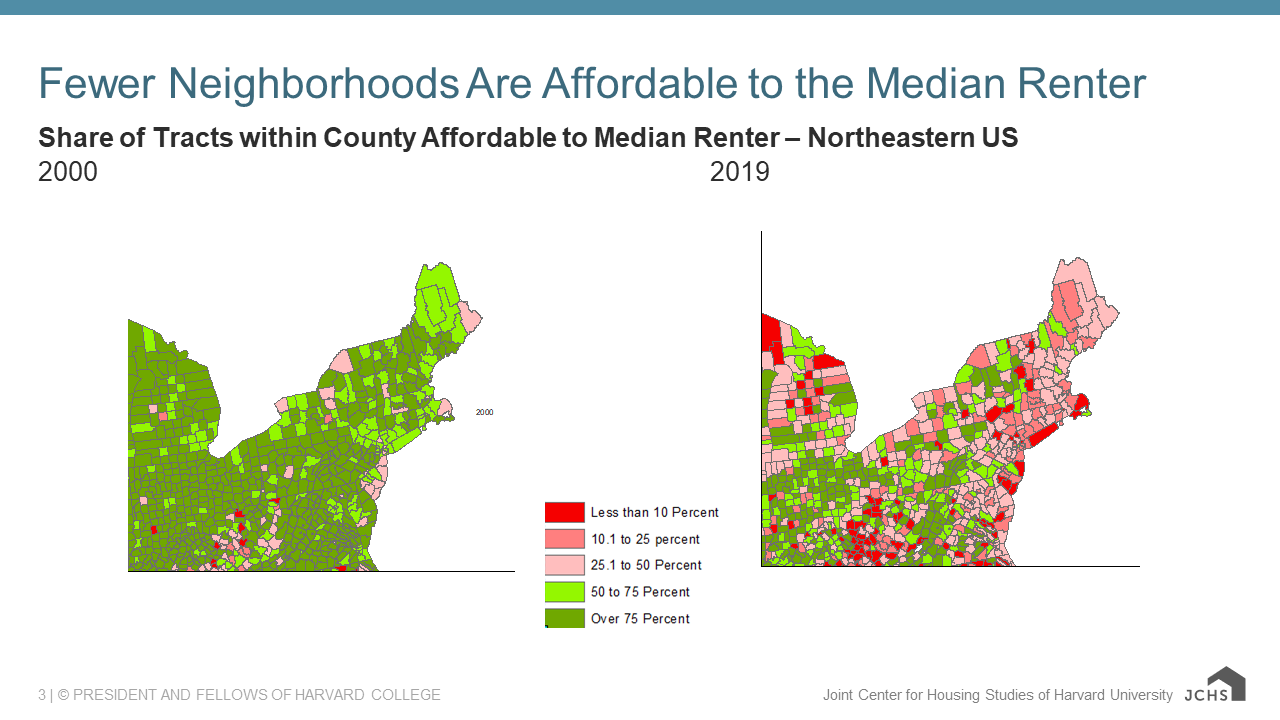
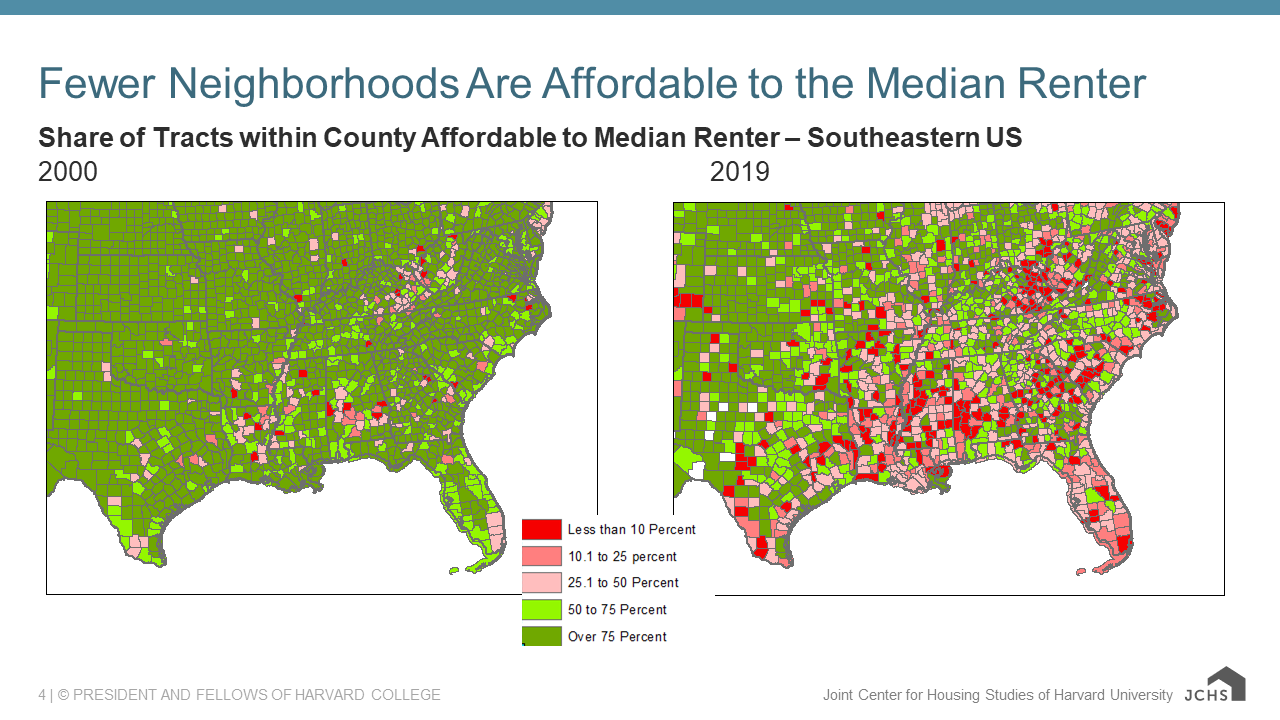
The share of tracts affordable to the typical renter declined in every state between 2000 and 2019. The largest declines and lowest rates in 2019 were in states in the Northeast such as Rhode Island, where in 2019, the median-income renter could afford the median rent in just 19 percent of all tracts, down from 61 percent in 2000. Still, the sharp drop in affordable neighborhoods is a nationwide trend. We find dozens of counties in regions all across the country where less than 10 percent of tracts were affordable to the median income renter in 2019 (Figure 2).
Figure 2: In Counties Across the Country, Fewer Neighborhoods Are Affordable to the Median Renter

We can also look within counties to see exactly where those affordable neighborhoods are within a state or a metropolitan area. In the Boston metro area, for example, we saw neighborhood affordability disappearing between 2000 and 2019 in nearly all tracts within neighborhoods of Boston like South Boston, as well as in neighboring cities and towns such as Cambridge, Somerville, Newton, Watertown, and Brookline (Figure 3). We see how the neighborhoods with affordable rents become fewer and more isolated across the area.
Figure 3: Neighborhood Affordability Eroding in and around the Boston Metro Area
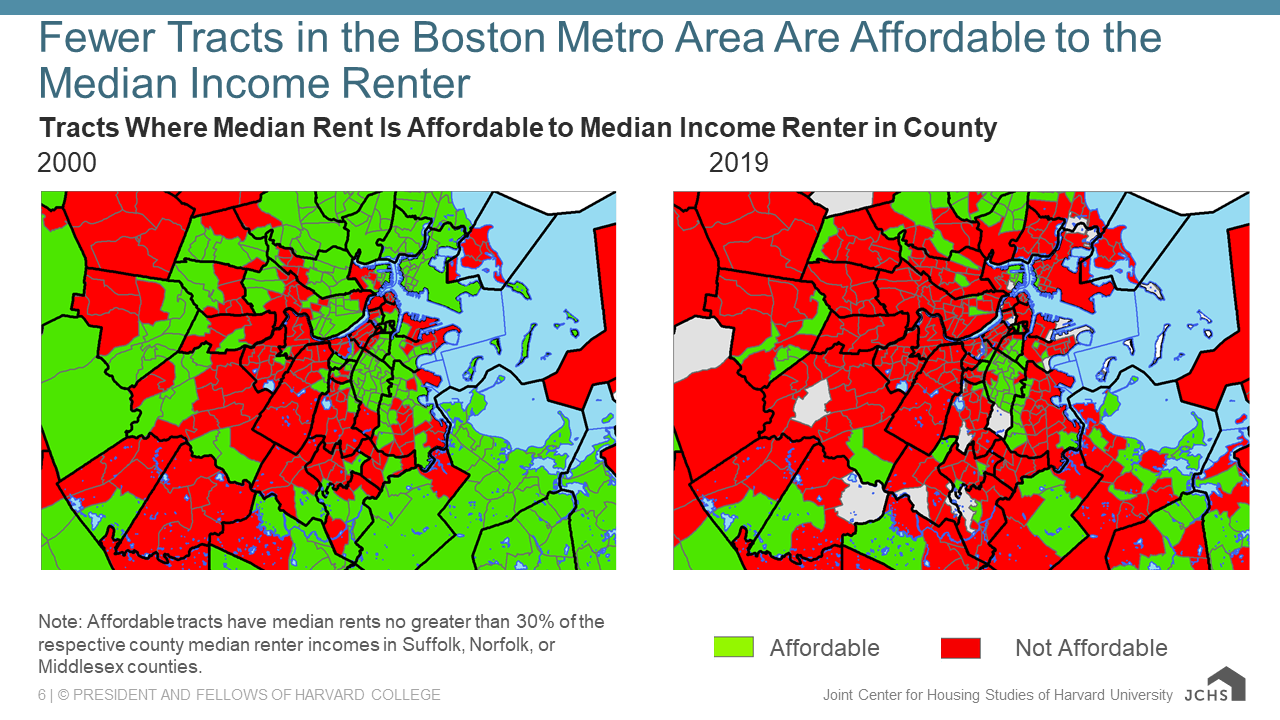
Note: Affordable tracts have median rents no greater than 30% of the respective county median renter incomes in Suffolk, Norfolk, or Middlesex counties.
With a growing set of research on how place matters for life outcomes, such as the importance of one’s childhood tract or zip code on adult success, we find that fewer and fewer neighborhoods are affordable or accessible to median income renters unless they pay high shares of income on rent. So what does that mean for low-income renters? With losses of low-rent units not being replaced by new construction (which is largely aimed at the high end of the market), policymakers must make increasing efforts not only to replace units lost and increase the supply of low-cost rental housing, but also to preserve and restore access to high-quality neighborhoods so that every household has a chance for opportunity.