
Is There a Better Way to Measure Housing Affordability?
When the Joint Center for Housing Studies estimates the extent of housing affordability problems, we typically start by measuring the number and share of households paying more than 30 percent of their income for shelter. This widely used metric, which is the basis for analyses in our annual State of the Nation’s Housing report, is based on the notion that, when spending on housing exceeds the 30-percent threshold, people don’t have enough money left over to pay for life’s other necessities.
But with housing affordability challenges at near-record levels, it is important to consider whether this long-used standard continues to be a reliable measure. This reassessment is particularly appropriate given the notable changes that have occurred over the decades in the relative costs of food, clothing, and other necessities, the growth in the number and share of one- and two-person households, and the increased frequency of burdens among moderate-income households that may have enough money left over for non-housing essentials even after paying 30 percent of their income on housing.
In a new Joint Center working paper we, along with Alexander Hermann, examine whether an alternative measure, based on the concept of residual income, would produce different assessments of the extent and incidence of housing affordability challenges. This alternative approach improves on the simple 30-percent standard by estimating the cost of “everything else” as a function of the number and ages of all household members. It then estimates how much income would be available to pay for housing if those other costs were fully covered.
The paper uses this approach to compare housing-burden rates under the two measures in three disparate metropolitan areas – Los Angeles (which has relatively high housing costs), Phoenix (which has moderate housing costs), and Cleveland (where costs are low). The exercise indicates that while there are some large differences in family types and income levels within each metro, the two measures produce very similar estimates of the rate and level of cost burden for each metropolitan area as a whole (Figure 1).
Figure 1: The Residual Income and 30-Percent Affordability Standards Produce Similar Share of Cost Burdened Renters in Three Markets
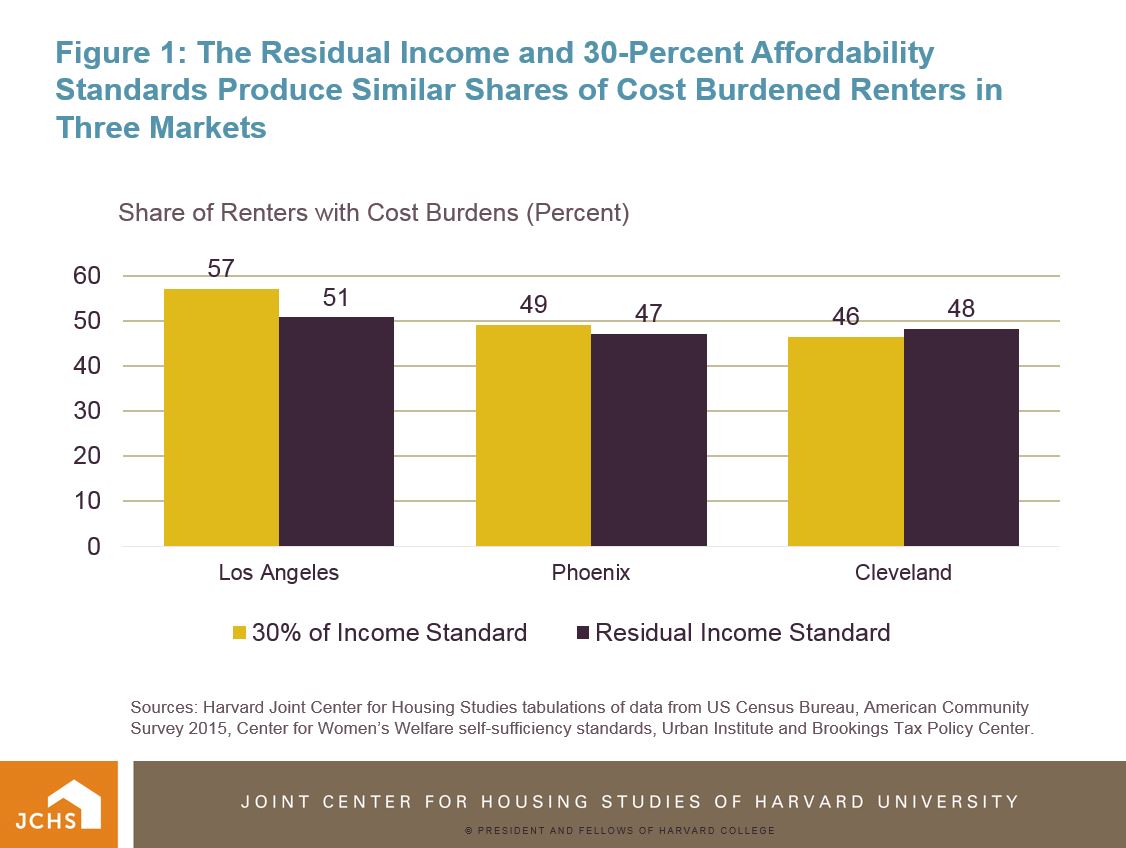
Sources: Harvard Joint Center for Housing Studies tabulations of data from US Census Bureau, American Community Survey 2015, Center for Women’s Welfare self-sufficiency standards, Urban Institute and Brookings Tax Policy Center.
The paper concludes by noting that while these results suggest the residual-income approach provides a better sense of how cost burdens vary across household types and household incomes, the 30-percent-of-income standard continues to be a valid measure of housing affordability across time and between areas. It also cautions that, given the many underlying assumptions and estimates needed for essential non-housing expenditures, there continue to be major questions about the precision of the residual-income measure and the feasibility of creating and updating such estimates for the entire country.
The residual-income approach to housing affordability
The residual income approach starts by identifying key categories of essential spending, which include food, health care, transportation, and child care. In addition, the measure includes a small allowance for other necessary expenses, such as clothing and household goods, and incorporates estimates of income taxes owed (or tax credits received). This estimated basic level of consumption for a household differs according to the number – and type – of people living in a given household. For example, households with large numbers of young children, often have higher costs for health care, food, and child care.
Under the residual income approach, the estimated cost of these necessities is subtracted from a household’s income. This calculation produces the amount – and share – of income that the household members can spend on housing and still have enough left over to cover other necessities. If households spend more on housing than the residual income approach indicates is feasible, they presumably cut back spending on other essential items.
In this framework, the share of income that can be devoted to housing is not a single standard, but rather varies depending on both the size and composition of the household and the level of household income. In general, larger households with more children will have more non-housing expenses and so can spend less on housing. Moreover, since the cost of everything else will represent a larger share of a household budget for those with lower incomes, the share of income that can be used for housing also rises as incomes increase.
For these and other reasons, the residual-income approach clearly offers the prospect of generating a more precise measurement of cost burdens for households than the rigid 30-percent standard. However, the precision comes with several downsides. To begin with, the precision is built on several assumptions about what constitutes a ‘basic’ level of consumption for a specific household and what these basics actually cost. Further, to allow for variations in the cost of living, the cost estimates have to be made on a market-by-market basis. And, if the measure is to serve as a useful indicator of changes in affordability over time, these estimates have to be regularly updated.
Comparing the results
Given these obstacles, it’s important to ask: does the residual-income approach produce significantly different findings than the easier-to-use 30-percent-of-income standard? The paper answers this question by using the two approaches to develop cost-burden estimates for households of various types and income levels in the three metros mentioned (Los Angeles, Phoenix, and Cleveland).
This exercise produces four major findings:
- Overall burden rates and levels for the metro areas did not differ very widely. In the three areas studied the residual income approach dampened differences across markets but high-cost Los Angeles continued to have the highest cost-burden rates.
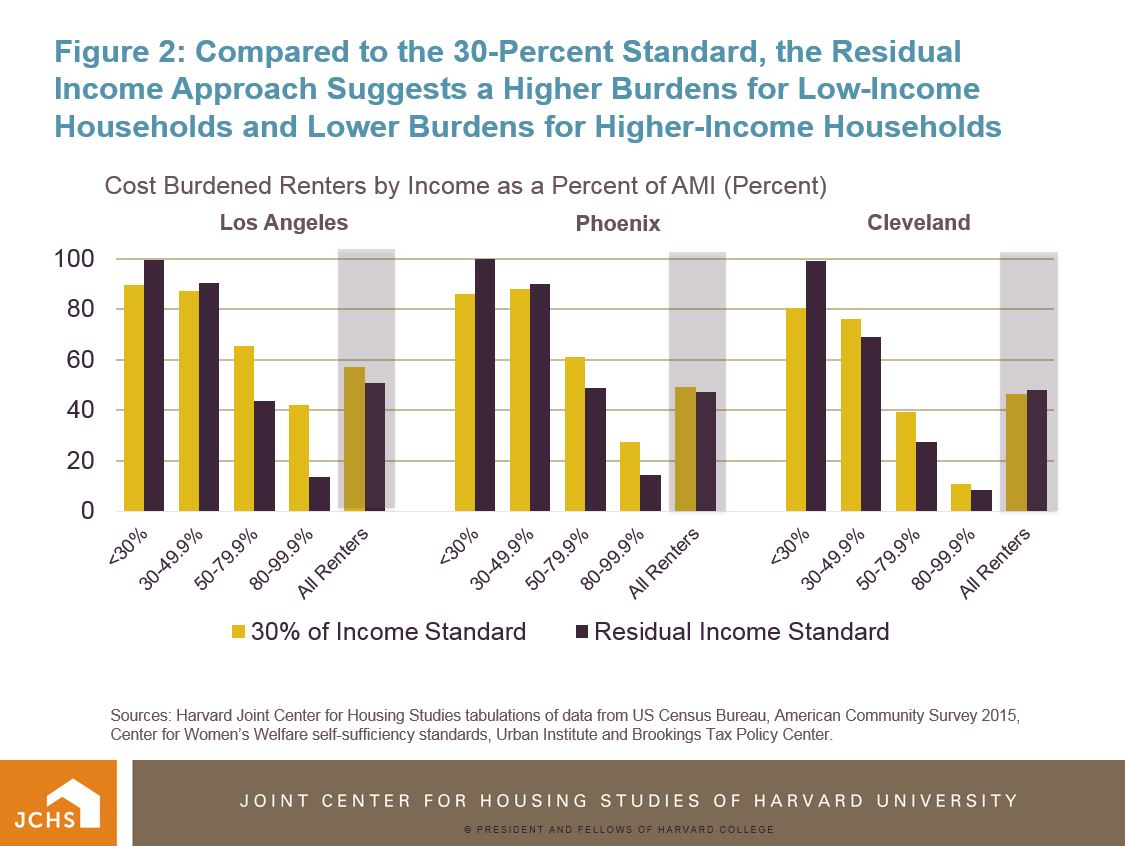
- In general, under the residual-income approach, smaller households were less likely to be considered burdened while larger households were more likely to be burdened. Additionally, while there were some exceptions, lowest-income households were more likely to be burdened while higher-income households were less likely to be burdened under the residual-income approach (Figure 2).
Figure 2: Compared to the 30-Percent Standard, the Residual Income Approach Suggests a Higher Burdens for Low-Income Households and Lower Burdens for Higher-Income Households
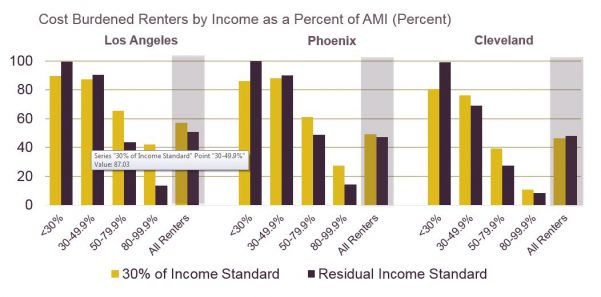
Sources: Harvard Joint Center for Housing Studies tabulations of data from US Census Bureau, American Community Survey 2015, Center for Women’s Welfare self-sufficiency standards, Urban Institute and Brookings Tax Policy Center.
- Regardless of household size, the lowest-income households were more likely to be burdened under the residual-income approach than under the 30-percent standard. Even single-person households, which were much less likely to be considered burdened under the residual-income approach overall, had higher burden rates at the lowest income levels.
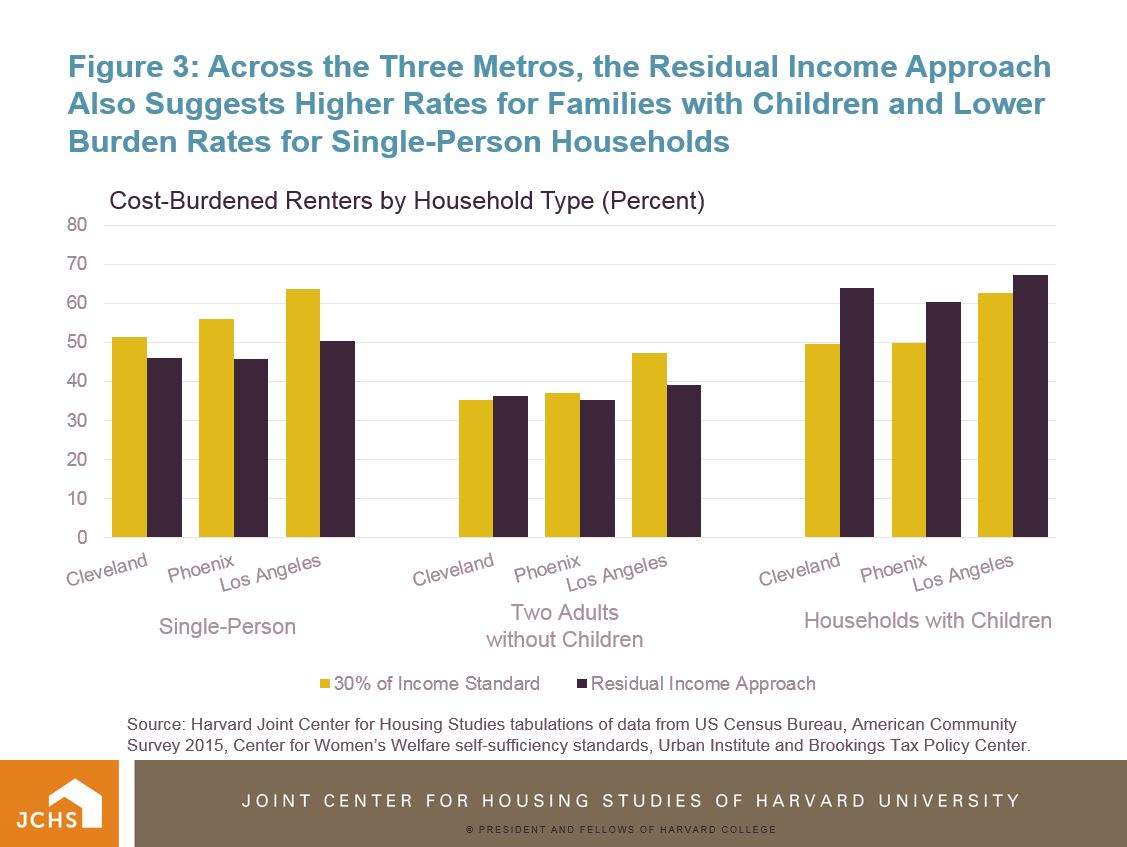
- Except for families with children, moderate- and higher-income households were less burdened under the residual income approach. With little exception, families with children were more likely to be burdened under the residual-income approach, regardless of income level (Figure 3).
Figure 3: Across the Three Metros, the Residual Income Approach Also Suggests Higher Rates for Families with Children and Lower Burden Rates for Single-Person Households
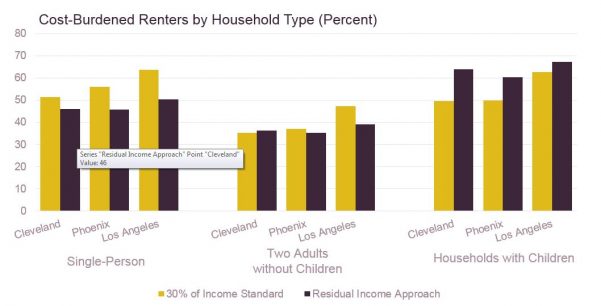
Sources: Harvard Joint Center for Housing Studies tabulations of data from US Census Bureau, American Community Survey 2015, Center for Women’s Welfare self-sufficiency standards, Urban Institute and Brookings Tax Policy Center.
In the end, this paper finds that, compared to the residual income measure, the 30-percent standard tends to overstate housing affordability challenges in high-cost markets and for higher-income and smaller households but yields similar results with respect to overall levels of affordability. Thus, given the simplicity of the 30-percent standard, it remains a reliable indicator of affordability both over time and across markets. However, the results also indicate that caution should be used in comparing affordability challenges across income levels or household types.