
Interactive Tool Illustrates the Disparate Economic Impacts of the Pandemic
It’s been well-documented that households of color, especially those who rent or have lower incomes, have been particularly hard-hit, economically, by the pandemic. Last November, in conjunction with our State of the Nation’s Housing report, we released an interactive tool which included data from the Census Bureau’s Household Pulse Survey through late September. Updating the tool to include the subsequent six waves of data from the survey, we see that those trends continued through the end of the year, and conditions overall worsened for both renters and homeowners.
The Unequal Financial Impacts of the Pandemic
The interactive displays the economic impacts of the pandemic by tenure and household income, race, age, and housing structure type. The data show a modest uptick in the share of households with lost employment income and housing payment delinquencies since we released our report in November. Nearly 15 percent of renters were behind on their rent in the second half of September, rising to 18 percent by mid-December (Figure 1). Likewise, the share of renters who suffered a decline in income due to the pandemic increased from 49 to 56 percent over the same period. While not as severe, conditions for homeowners have also worsened. Just under 11 percent of homeowners were behind on their mortgage payments in December (up from 9 percent in September) and 40 percent lost employment income (up from 36 percent).
Figure 1: Both Housing Insecurity and Income Loss from the Pandemic Ticked Up at the End of 2020
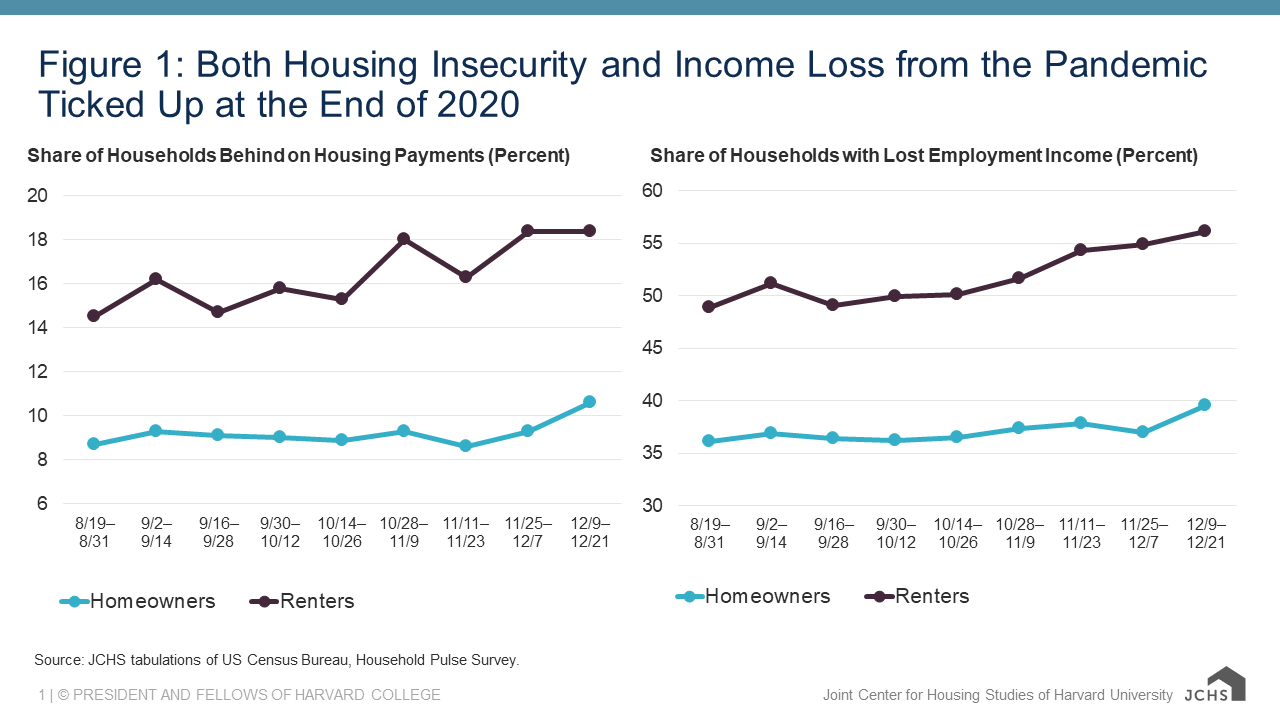
Source: JCHS tabulations of US Census Bureau, Household Pulse Survey.
While the continuation of the economic disruption is notable, the most recent data also reinforces our report’s key findings: there remain significant disparities in income loss and housing payment delinquencies since the COVID-19 pandemic began, particularly by income and race.
In total, 45 percent of households reported that they had lost employment income between mid-March and December, including over half of renter households and two-fifths of homeowner households. Lower-income households, who tend to have fewer resources to begin with, were more likely to lose employment income, reflecting the ability of many higher-wage earners to work from home while lower-wage earners were laid off or had their hours cut back. Lower-income households were also far more likely to report being behind on their housing payments as of December, with about a quarter of renters and one-fifth of homeowners with a mortgage who make less than $25,000 struggling to make payments.
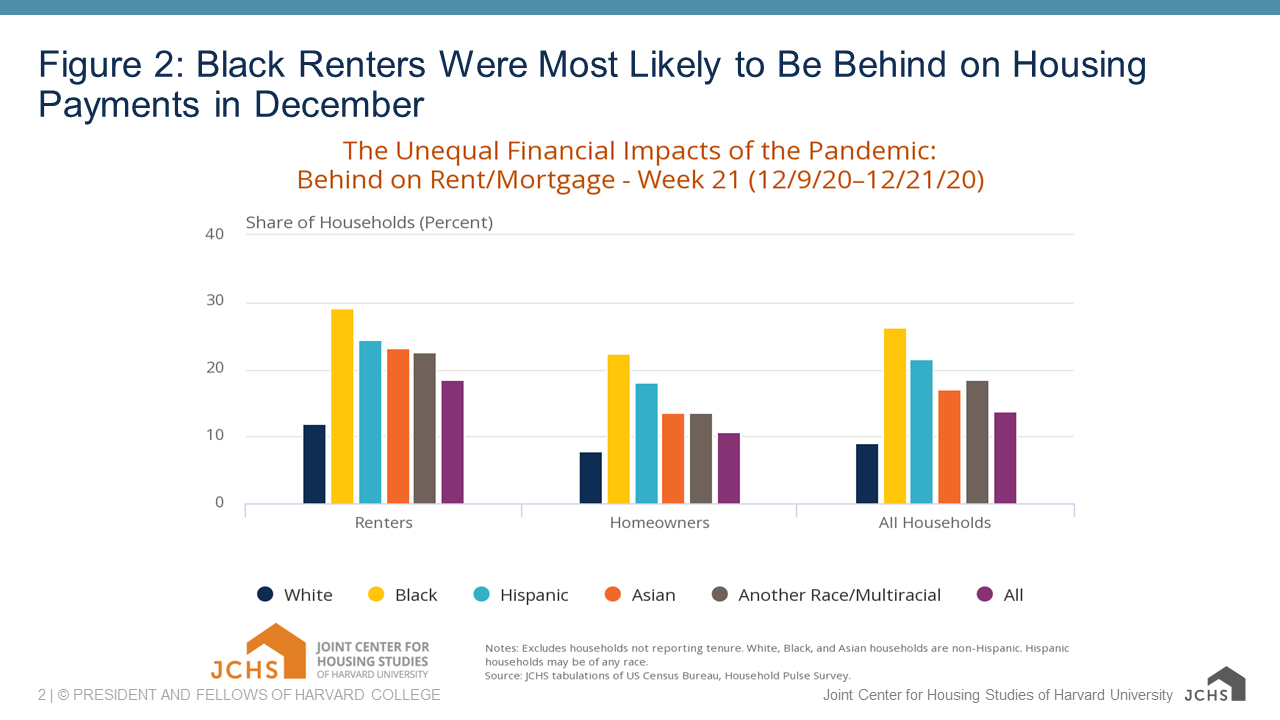
The pandemic has also had a notably disparate impact by race and ethnicity. Lower shares of white (40 percent) and Asian (41 percent) respondents experienced loss of employment income in December as compared to Black (53 percent) and Hispanic (59 percent) respondents. Black renters had the highest rates of being behind on housing payments at 29 percent (Figure 2). Among homeowners with a mortgage, Black households also had the highest rates of missed or partial payments at 22 percent, followed by Hispanic households at 18 percent. And whether they rent or have a mortgage, white households had the lowest rates of rent or mortgage payment delinquencies.
Figure 2: Black Renters Were Most Likely to Be Behind on Housing Payments in December
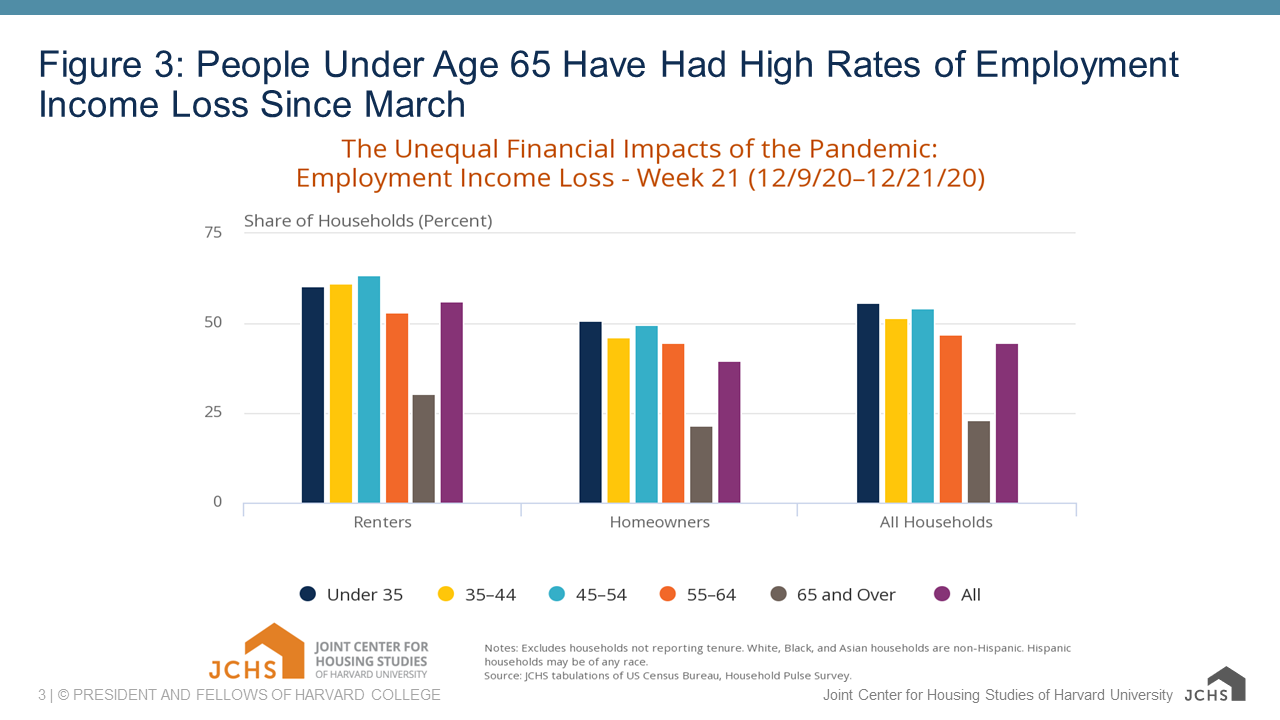
Younger respondents had much higher rates of income loss, with nearly half of those under 65 reporting they had lost at least some employment income since March (Figure 3). In comparison, just 23 percent of respondents 65 and over lost income. Renter households under 55 have been most impacted, with 63 percent of renters aged 45–54 losing income. This group has also had the greatest difficulty making rent payments; just over a quarter of renters in this age group were behind on rent in December.
Figure 3: People Under Age 65 Have Had High Rates of Employment Income Loss Since March
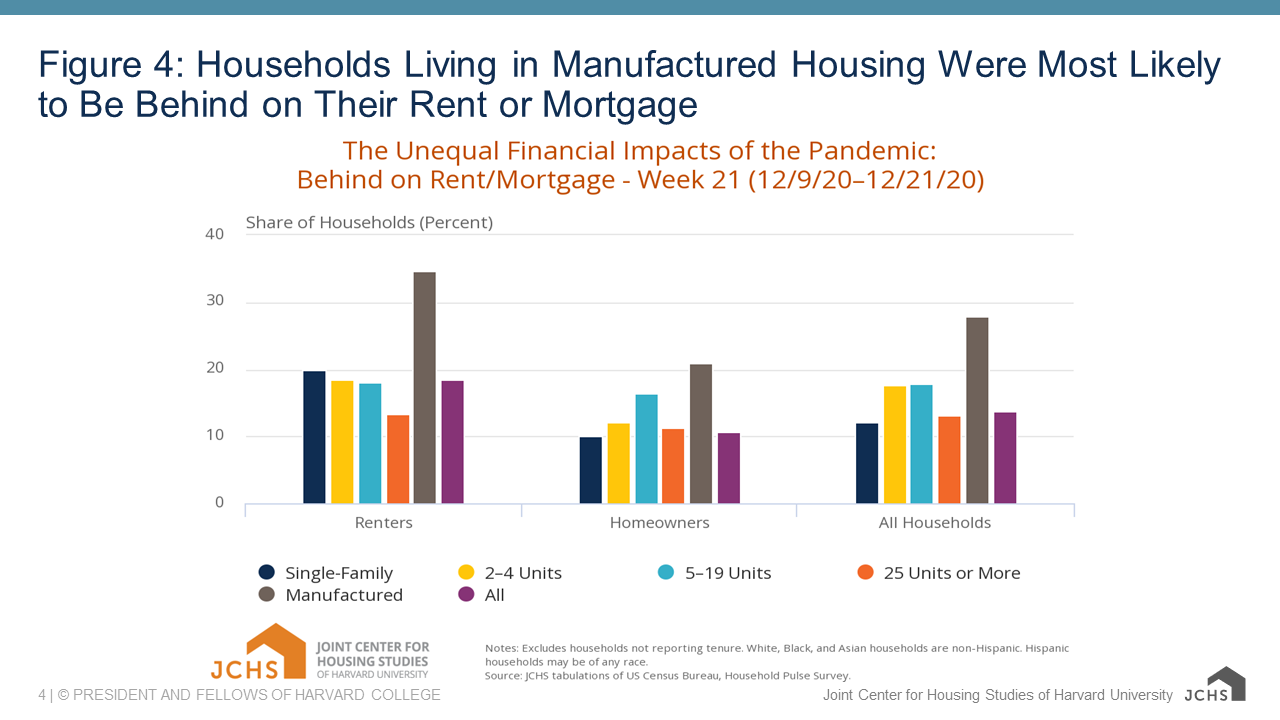
Nearly 60 percent of renters living in single-family rentals and two-thirds living in manufactured housing rentals have lost income. As the number of units in the building increases, the rate of employment loss among renters decreases, down to 45 percent for renters in buildings with at least 20 units. More than one-third of renter households living in manufactured housing also reported being behind on rent, putting them at risk of eviction (Figure 4). Households in single-family rentals and in smaller multifamily structures, which tend to be owned by small-investor landlords, also had higher rates of missed payments than renters in larger multifamily structures. Missed payments in these smaller rental buildings may be putting pressure on small landlords.
Figure 4: Households Living in Manufactured Housing Were Most Likely to Be Behind on Their Rent or Mortgage
Data from the ongoing Household Pulse Survey continues to illuminate the economic effects of the pandemic as the crisis unfolds. What has remained constant throughout, however, is the disparate impact on households of color, renters, and lower-income households.