
Interactive Chart Shows the Widespread Rise in Home Prices Since the Start of the Pandemic
Home prices have soared since the start of the pandemic, as documented in our new State of the Nation’s Housing report. An interactive chart released in conjunction with the report shows that rapid price increases were incredibly widespread in markets across the country.
Home Prices are Skyrocketing in Most Markets
Nationally, home prices were rising by double-digits at the end of 2020 for the first time since early 2014, according to the S&P CoreLogic Case-Shiller Home Price Index. This rise continued into 2021, with national home prices climbing 13.2 percent year-over-year in March, up from 4.2 percent on average in the first quarter of 2020 and 3.5 percent on average in 2019. As a result, the median sale price for existing homes was $326,300 in March, up from $280,700 just a year earlier. Over the long run, home prices have now risen for more than 100 consecutive months, pushing nominal home prices more than 30 percent above previous peaks in the mid-2000s.
The interactive, which allows users to view both nominal and real price changes since 2000 in one hundred large metro areas and divisions, shows that the recent rise in home prices wasn’t geographically concentrated. In fact, according to the FHFA Purchase-Only House Price Index, nominal home prices in the first quarter of 2021 increased by at least 10 percent in 85 of 100 markets, up from just 5 markets the year prior. Even in inflation-adjusted terms, home prices were up 10.4 percent nationally and by double-digits in 62 markets.
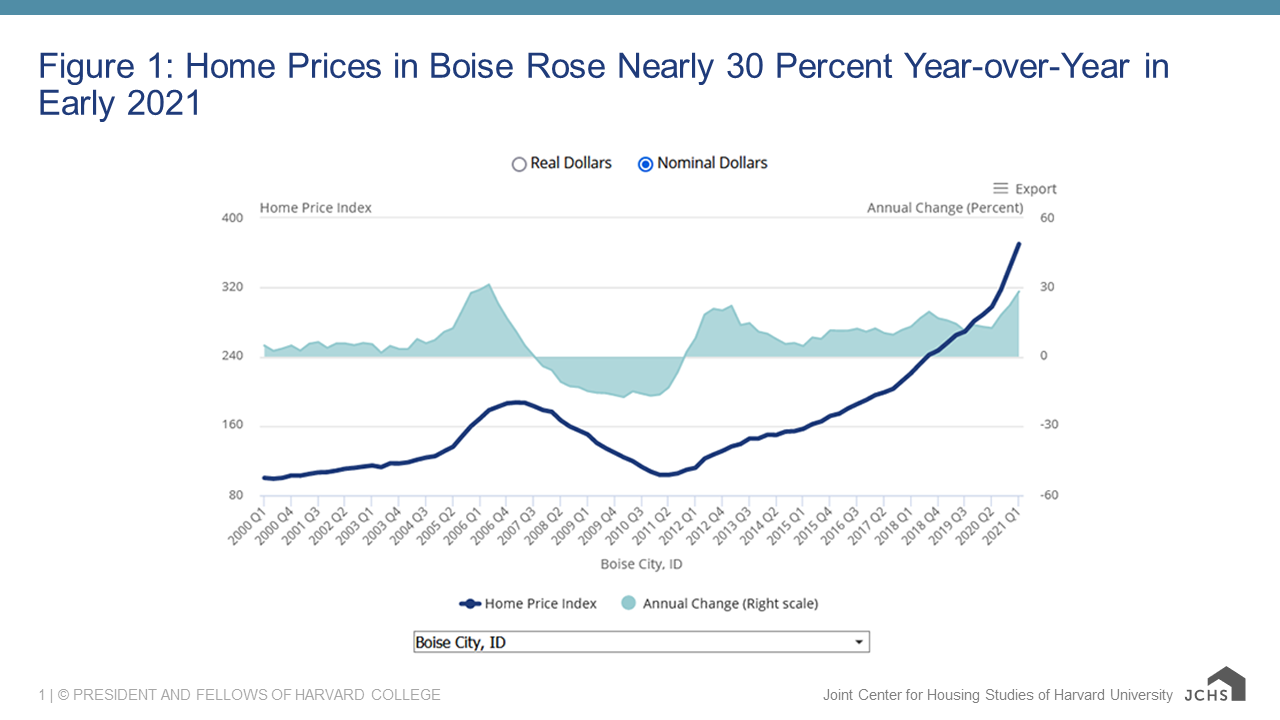
Home prices rose fastest in the West and in several Texas markets, climbing an astounding 28.2 percent in Boise, 22.7 percent in Austin, and 21.6 percent in Tacoma, all markets with especially strong demand heading into the pandemic (Figure 1). Annual home price growth also exceeded 18 percent in three additional markets: Salt Lake City (18.4 percent), Phoenix (18.4 percent), and El Paso (18.0 percent). But rapid home price growth wasn’t confined to the West and South; among Midwestern markets, home prices rose 17.2 percent in Grand Rapids, 16.1 percent in Wichita, and 15.6 percent in Dayton. In the Northeast, home price growth was fastest in three markets with weaker demand heading into the pandemic: Bridgeport (17.0 percent), Worcester (16.3 percent), and Camden (16.2 percent).
Figure 1: Home Prices in Boise Rose Nearly 30 Percent Year-over-Year in Early 2021
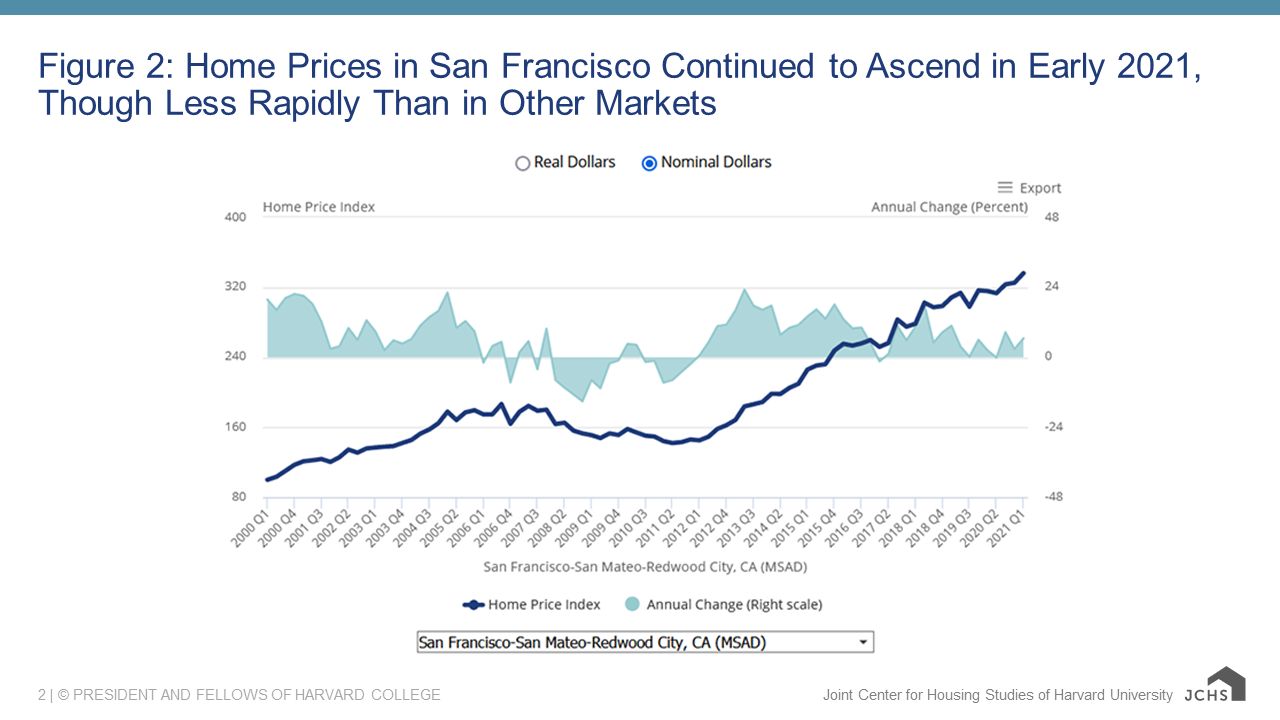
Nominal home prices declined in just one large market across the country: in Honolulu, one of the nation’s highest-cost markets, home prices ticked down 0.6 percent in the first quarter of 2021. Home price growth was slowest, but still substantial, in Baton Rouge (6.4 percent), San Francisco (6.5 percent), Little Rock (7.1 percent), and New Orleans (7.9 percent) (Figure 2). Other notable markets with under 10 percent home price growth include New York (9.7 percent), Chicago (9.6 percent), San Jose (9.6 percent), and Houston (9.5 percent). But even in these markets, home prices were rising faster at the beginning of the year compared to the first quarter of 2020. In fact, among the 100 markets, only Honolulu experienced less rapid home price growth in early 2021 compared to a year earlier.
Figure 2: Home Prices in San Francisco Continued to Ascend in Early 2021, Though Less Rapidly Than in Other Markets
The rapid rise in home prices could offer protection to existing homeowners in the form of increasing equity for those who’ve struggled to keep up with their mortgage payments since the start of the pandemic. For about 2 million homeowners still in forbearance, for example, selling their home could be an option if they are unable to resume mortgage payments at the end of the forbearance period. However, rapidly rising home prices also elevate concerns about affordability, especially for potential homebuyers who might struggle with the higher downpayments that higher home prices often entail.