
How This Recession is Expected to Affect Home Improvement Spending
After almost a decade of sustained growth in spending for home improvement projects, remodeling activity is likely to decline during the pandemic-induced economic downturn. In fact, in the Farnsworth Group’s first quarter 2020 Contractor Index Survey conducted in late March, many remodeling contractors already had experienced delayed or cancelled projects. On average, contractors projected a 10 percent decline in revenue over the coming 12 months. Our first quarter 2020 Leading Indicator for Remodeling Activity (LIRA) also pointed to an emerging decline in maintenance and improvement spending by homeowners.
However, historical evidence suggests that the magnitude of the downturn will depend on the evolving mix of home improvement projects, and the reasons households undertake those projects. Even before COVID-19 put the brakes on remodeling spending, there were signs that a broader slowdown for the industry was underway. Sales of existing homes, one of the best indicators of future home improvement spending, hadn’t grown over the past two years, housing starts remained well below the longer-term needs generated by population growth, and although house prices bounced back from the Great Recession, they were growing relatively slowly in most markets.
Our estimates of total spending for maintenance, repairs, and improvements to owner-occupied housing units totaled almost $330 billion last year, up from $222 billion in 2009, when the industry was just finishing a three-year downturn (Figure 1). The 4 percent average annual growth in remodeling spending over the past decade shows how steadily the industry grew coming out of the last recession.
Figure 1: Heading into 2020, Home Improvement & Repair Spending Had Seen Strong, Steady Growth Nationally For Much of Past Decade
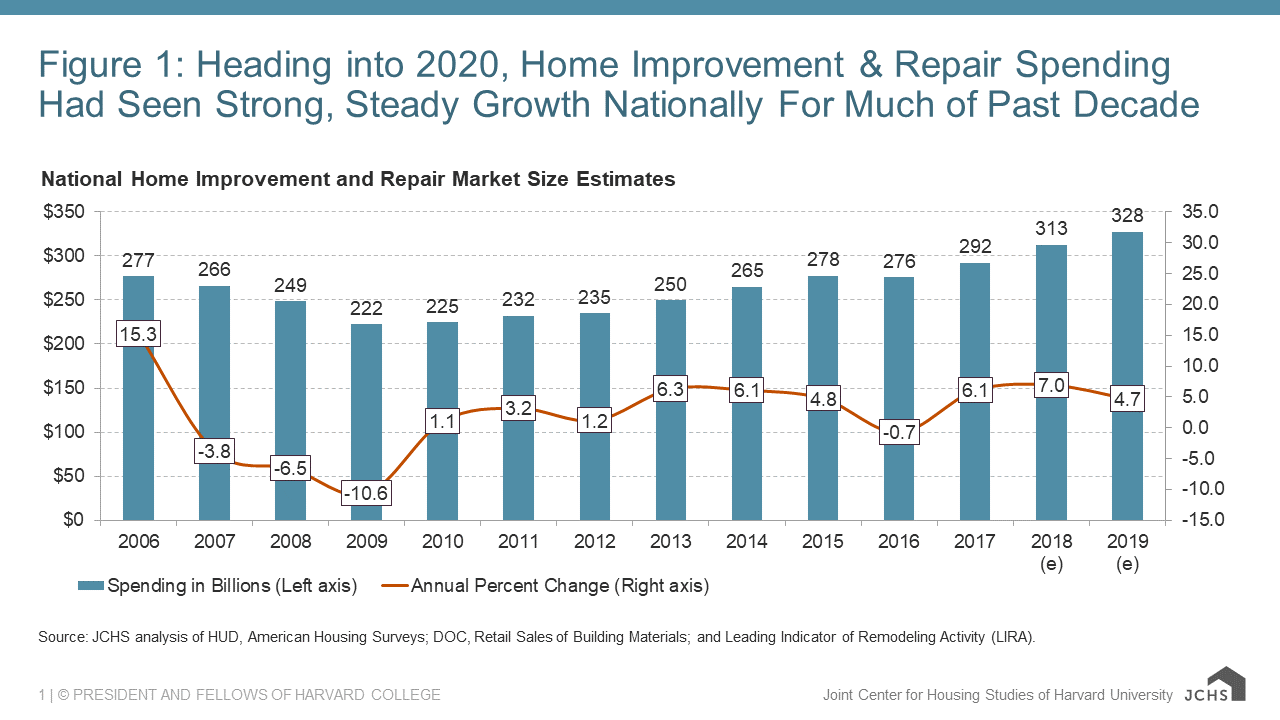
Source: JCHS analysis of HUD, American Housing Surveys; DOC, Retail Sales of Building Materials; and Leading Indicator of Remodeling Activity (LIRA).
Still, the mandated slowdown of the national economy to address the pandemic has clearly depressed remodeling spending well beyond a cyclical slowdown. National economic recessions typically have a marked effect on household spending patterns for home improvement projects. During the Great Recession, spending to improve the existing housing stock in the US declined by almost 25 percent. However, during the previous economic downturn – the dot-com recession in 2001 – home improvement spending declined a scant 4 percent from its market peak to eventual trough. Even the sometimes dramatic swings experienced by home improvement spending tend to pale in comparison to those of homebuilding. Spending on new homes didn’t experience any decline during the 2001 recession but saw a whopping 75 percent decline during the Great Recession (Figure 2).
Figure 2: For Deep Recessions, Remodeling Spending Typically More Cyclical Than Broader Economy, But Less Than New Construction
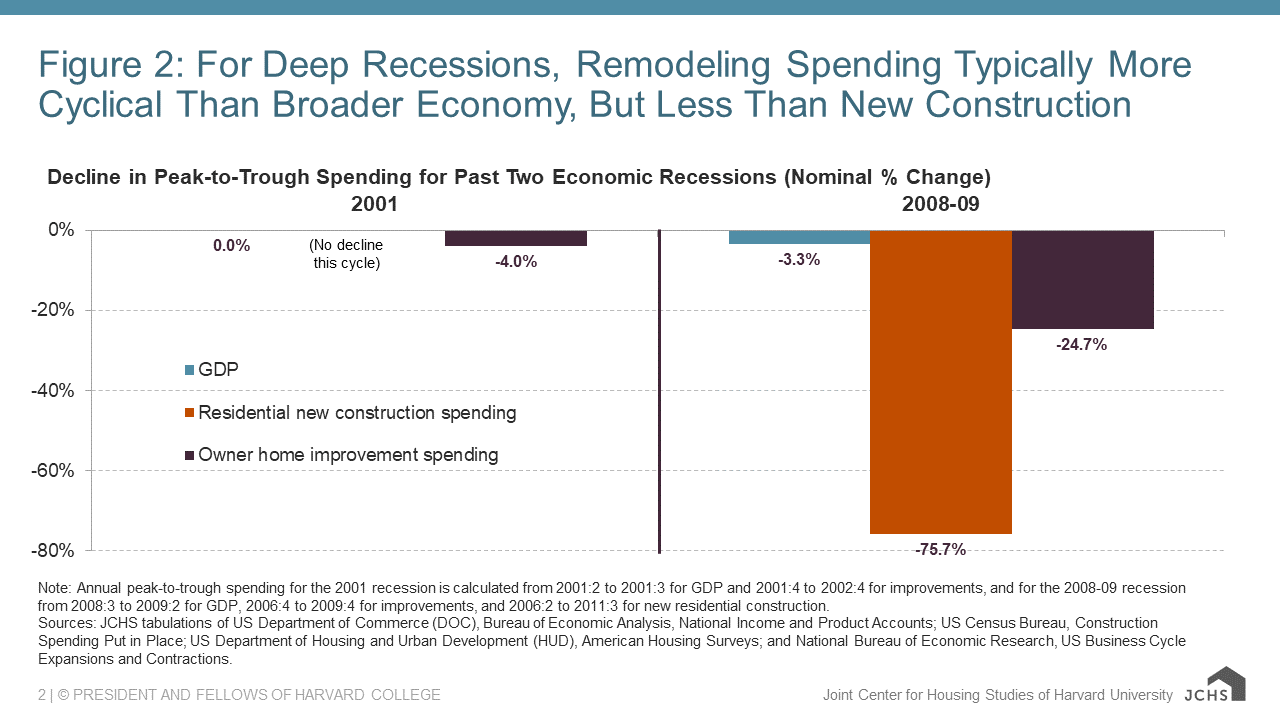
Note: Annual peak-to-trough spending for the 2001 recession is calculated from 2001:2 to 2001:3 for GDP and 2001:4 to 2002:4 for improvements, and for the 2008-09 recession from 2008:3 to 2009:2 for GDP, 2006:4 to 2009:4 for improvements, and 2006:2 to 2011:3 for new residential construction.
Sources: JCHS tabulations of US Department of Commerce (DOC), Bureau of Economic Analysis, National Income and Product Accounts; US Census Bureau, Construction Spending Put in Place; US Department of Housing and Urban Development (HUD), American Housing Surveys; and National Bureau of Economic Research, US Business Cycle Expansions and Contractions.
Regardless of the magnitude of the current downturn for home improvement spending, however, some market sectors can be expected to see a steeper decline than others. For the typical homeowner, their home is their single most important investment, and as such households have historically made the maintenance and improvement of their homes a top priority, even in challenging economic times. However, there are criteria that households generally use to prioritize which projects they need to undertake more immediately, and which they can defer. Generally, when budgets are tight and economic times are uncertain, households are more likely to undertake the projects themselves on a DIY basis, defer discretionary projects and focus on those that have a greater impact on maintaining and preserving their home, and downscale the scope of the project to the extent possible.
Different market segments behave differently during downturns
Despite the consensus view that spending on home improvements and repairs is expected to decline in the coming quarters, previous economic cycles have shown that some market segments are more vulnerable to downturns than others. In fact, even with a severe cutback in overall spending, historical evidence suggests that some sectors will see only a modest impact on activity, and potentially even experience gains. Prior remodeling cycles suggest that there are at least four dimensions that will influence how well specific home improvement categories will perform during an economic downturn: the method by which the project is installed; the size of the project; whether the project is a “want to do” or a “need to do” project; and the characteristics of the home and the household undertaking the project.
1. Method of installation. In deciding to undertake a home improvement project during a downturn, some may choose to save money by undertaking projects themselves (DIY) rather than hiring a professional contractor to handle the installation. Recently, stay-at-home requirements have given households the motivation and opportunity to undertake many DIY home projects. Still, over the past few decades, the DIY share of market spending has been around 20 percent, and steadily declining. However, since a DIY project encompasses only product purchases and not labor and indirect costs, the DIY share of product purchases is actually much higher.
Still, the DIY share of spending does vary with economic conditions. Since a household can save on project costs by doing their own installation, for many project categories the DIY share may increase during downturns. At least partially offsetting this consideration, however, many non-discretionary projects that may hold up better during economic downturns – exterior replacements and systems upgrades – are less likely to be undertaken on a DIY basis due to the technical skills required. Additionally, older households are much less likely to undertake DIY projects, so the growth in older owners has tempered DIY growth.
2. Project category. A significant share of home improvement activity involves upgrading or adding onto existing facilities, such as kitchen and bath remodels or room additions. Owners often scale back or defer these so-called discretionary projects if there is concern over the economic outlook. In contrast, exterior replacement projects (such as roofing, siding, or window replacements) or systems upgrades (such as plumbing, electrical, or HVAC projects) generally are more difficult to defer.
As such, the discretionary project share of home improvement spending generally rises during economic expansions and declines during economic downturns. The share of total owner spending on additions and major alterations and kitchen and bath remodels fell during the Great Recession. In contrast, the share of spending on exterior replacement and systems and equipment upgrades increased over this period (Figure 3).
Figure 3: The Share of Spending on Discretionary Projects Declined During Last Downturn
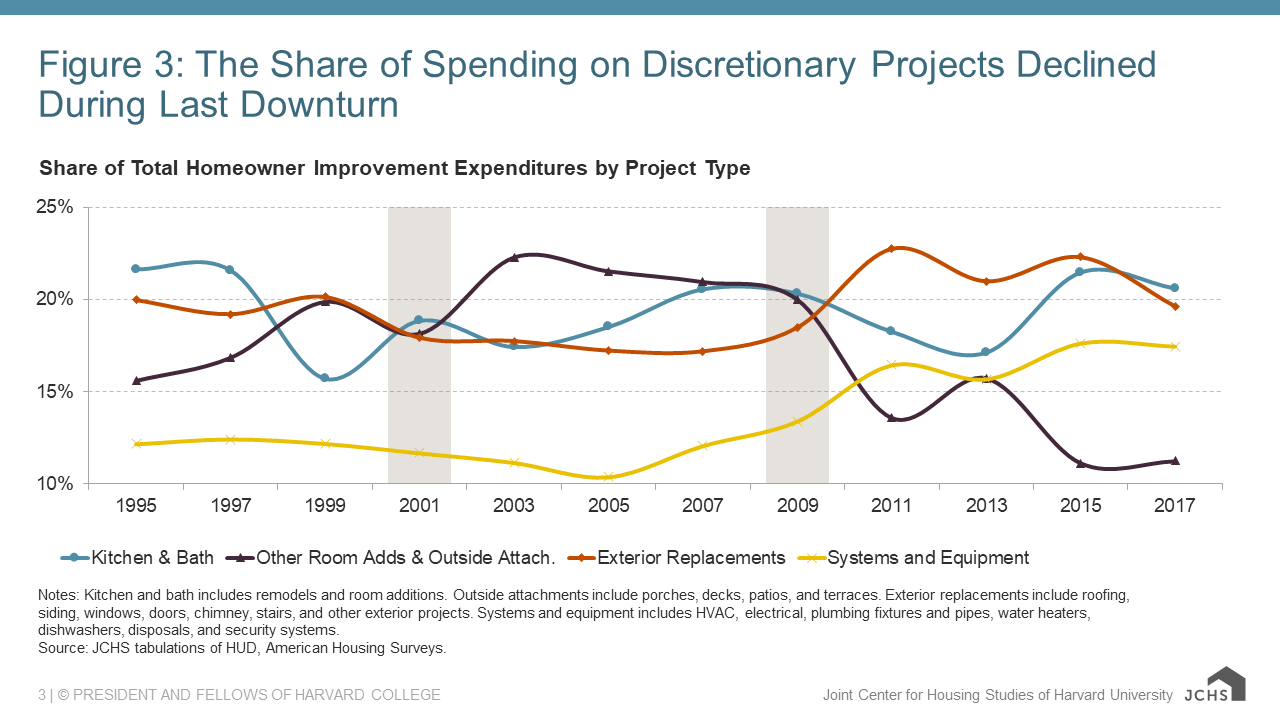
Notes: Kitchen and bath includes remodels and room additions. Outside attachments include porches, decks, patios, and terraces. Exterior replacements include roofing, siding, windows, doors, chimney, stairs, and other exterior projects. Systems and equipment includes HVAC, electrical, plumbing fixtures and pipes, water heaters, dishwashers, disposals, and security systems.
Source: JCHS tabulations of HUD, American Housing Surveys.
3.Project size. When the economy weakens, households typically scale back on the size of their projects. An upper-end project may turn into a mid-level version. A full-scale remodeling project may be converted to the replacement of a few project elements.
For example, households reporting home improvement projects in 2009, at the low point of the previous cycle, spent an average of $9,300 (adjusted for 2017 dollars) compared to the almost $12,000 inflation-adjusted remodeling expenditure in 2007. This lower average project size was not only from the changing mix of projects, such as switching from more expensive discretionary projects to less expensive replacement projects, but also from a general downsizing of projects within a category. In 2009, the average expenditure for both discretionary and replacement projects was 15-20 percent less in inflation-adjusted dollars than the average 2007 expenditures for projects in those categories.
4. Home value and household income. Higher-income households account for a disproportionate share of home improvement spending. Over the past two decades, households in the top 20 percent of the income distribution have averaged about 40 percent of all spending on home improvement projects. One reason for this is higher-income households tend to live in larger and more expensive homes with more products and features that require regular replacement and upgrading.
Additionally, though, upper-income households spend more on discretionary home improvement projects like upper-end kitchen and bath remodels, room additions, and structural alterations. During economic downturns, discretionary spending tends to decline, even among households that might be thought to have sufficient income to undertake these projects regardless of the condition of the economy. In 2007, households in the top 20 percent of the income distribution accounted for just under 44 percent of all homeowner home improvement spending. Those in the middle quintile accounted for just under 16 percent of all spending, while those in the bottom quintile accounted for less than nine percent. By 2009, the share of spending by owners in the top income quintile had declined to under 40 percent, the share for the middle quintile nudged up a very modest amount, while those in the bottom 20 percent increased their share to almost 11 percent (Figure 4).
Figure 4: Share of Spending by Income is Fairly Stable Across the Cycle; Upper-Income Household Share Dips a Bit During Recessions
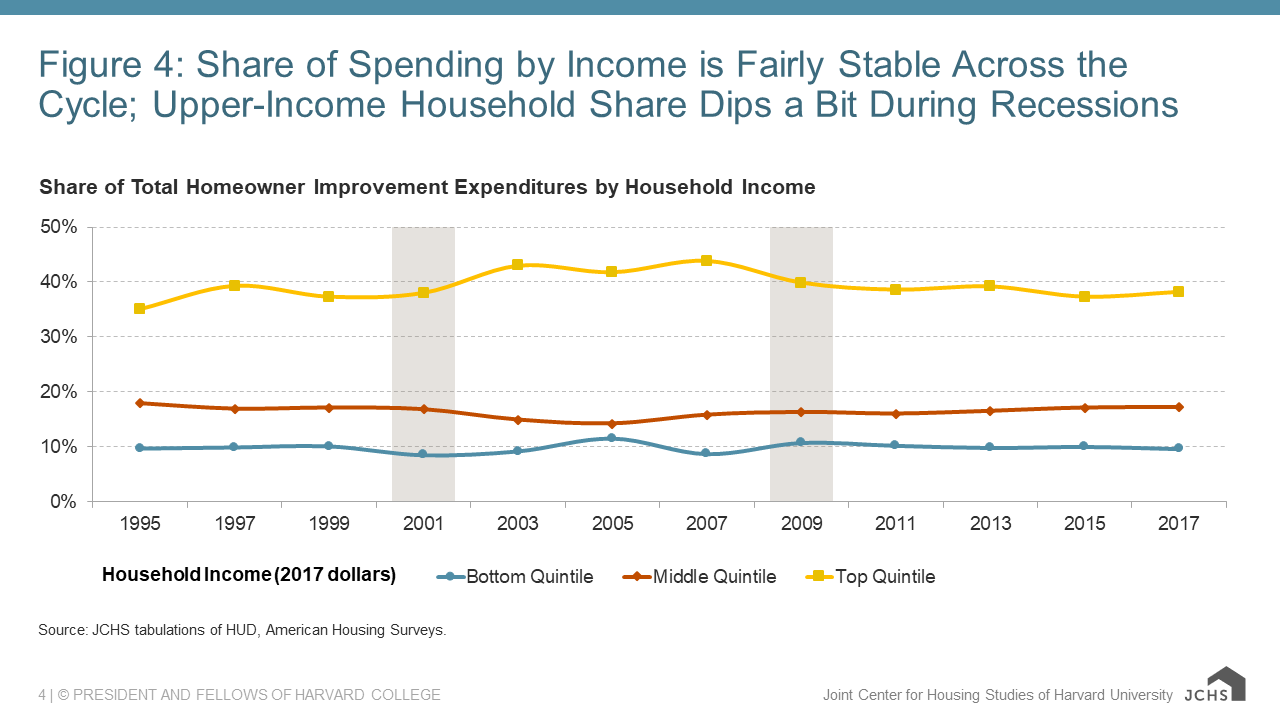
Source: JCHS tabulations of HUD, American Housing Surveys.
After almost a decade of sustained increases in spending for home remodeling projects, the industry appears to be entering a significant downturn. However, historical evidence suggests that the magnitude of that downturn will depend on the changing mix of home improvement projects, and the household’s motivations for undertaking projects. Spending on replacement projects and system upgrades will likely hold up better than spending on discretionary projects. Smaller-scale projects will likely hold up better than larger ones. DIY activity is likely to become a larger share of spending in many project categories. And finally, upper-income households are not likely to continue to pace the growth in spending in the industry. To the contrary, lower- income households are likely to increase their share of total remodeling market spending.