
Home Repairs and Updates Pose Considerable Burdens for Lower-Income Homeowners
Lower-income homeowners spend large shares of their incomes on home improvements and maintenance, but spend significantly less per household compared to higher-income homeowners, according to a new analysis by the Center’s Remodeling Futures Program of HUD’s latest American Housing Survey from 2019. Households with lower incomes also tend to focus their remodeling and repair dollars on different types of projects, with a larger proportion of their budgets going toward maintenance, replacements, and disaster repairs.
As noted in our most recent Improving America’s Housing report, limited financial resources make it difficult for homeowners with lower incomes to invest in basic maintenance, replace critical systems and equipment, repair damage from natural disasters, or make any improvements to their homes. According to analysis of the American Housing Survey, fully 30 percent of lowest-income homeowners (defined as those with incomes of less than $32,000 annually and representing 4.8 million households) spent nothing on home maintenance or improvement in 2019 (Figure 1).
Figure 1: Large Shares of Homeowners With Lower Incomes Spend Little or Nothing on Home Maintenance and Improvements

Notes: The lowest income quintile includes homeowners with incomes of less than $32,000. The highest income quintile includes homeowners with incomes of more than $144,000. Remodeling spending includes improvements and maintenance spending.
Source: JCHS tabulations of HUD, 2019 American Housing Survey.
Additionally, for lower-income homeowners, remodeling and repair projects typically consume a significant share of household income (Figure 2). While homeowners overall spent an average of 9.6 percent of their incomes on home improvements and maintenance in 2019, lowest-income homeowners spent nearly twice that share, with an average of 18.3 percent of their incomes going toward home improvements and maintenance. The average share for the highest-income homeowners was just 5.8 percent.
Figure 2: Lower-Income Homeowners Spend Three Times as Much of Their Incomes on Home Improvement and Maintenance Projects as Higher-Income Homeowners

Notes: The lowest income quintile includes homeowners with incomes of less than $32,000. The highest income quintile includes homeowners with incomes of more than $144,000. Homeowners with zero or negative income are assumed to spend 0% of income for improvements and repairs, while those spending over 100% are top-coded at 100%. Average share of income spent on home improvements and maintenance includes households with no spending.
Source: JCHS tabulations of HUD, 2019 American Housing Survey.
Per household, lower-income homeowners spend less on average on all types of home remodeling and repair projects, including replacement projects, discretionary projects, home maintenance, outside property improvements, and disaster repairs (Figure 3). In total, homeowners with incomes in the lowest quintile spent $2,290 per household on improving and maintaining their homes in 2019, around half of the $4,120 average for all homeowners. Homeowners in the highest income quintile spent more than triple that amount on average, at $7,610 per household.
Figure 3: Lower-Income Homeowners Spend Significantly Less Per Household on All Types of Home Improvement and Maintenance Projects

Notes: The lowest income quintile includes homeowners with incomes of less than $32,000. The highest income quintile includes homeowners with incomes of more than $144,000. Replacement projects include exterior, systems and equipment, and interior projects. Discretionary projects include kitchen and bath remodels, room additions, and outside attachments. Outside property includes such projects as driveways and walkways, fencing, sheds, landscaping, and recreational structures. Average spending per owner includes households with no projects. “All Projects” is the sum of replacement, discretionary, maintenance, outside property, and disaster repair spending.
Source: JCHS tabulations of HUD, 2019 American Housing Survey.
The limited financial resources of lower-income homeowners also shape the composition of their remodeling spending (Figure 4). A quarter of the remodeling and repair budgets of lower-income homeowners went towards basic home maintenance – well above the 16 percent share for homeowners in the highest quintile. Lower-income households also spent a higher share of their budgets on critical replacements such as roofing, windows and doors, and HVAC systems—updates that are more often “need to do” (at 39 percent vs. 34 percent) and double the share on disaster repairs (at 12 percent vs. 6 percent). In total, lower-income households spent roughly three quarters of their remodeling budgets on replacement projects, disaster repairs, and maintenance, which tend to be unavoidable costs for basic habitability.
Figure 4: A Higher Proportion of Lower-Income Homeowners’ Remodeling Budgets Goes Towards Maintenance, Replacements, and Disaster Repairs
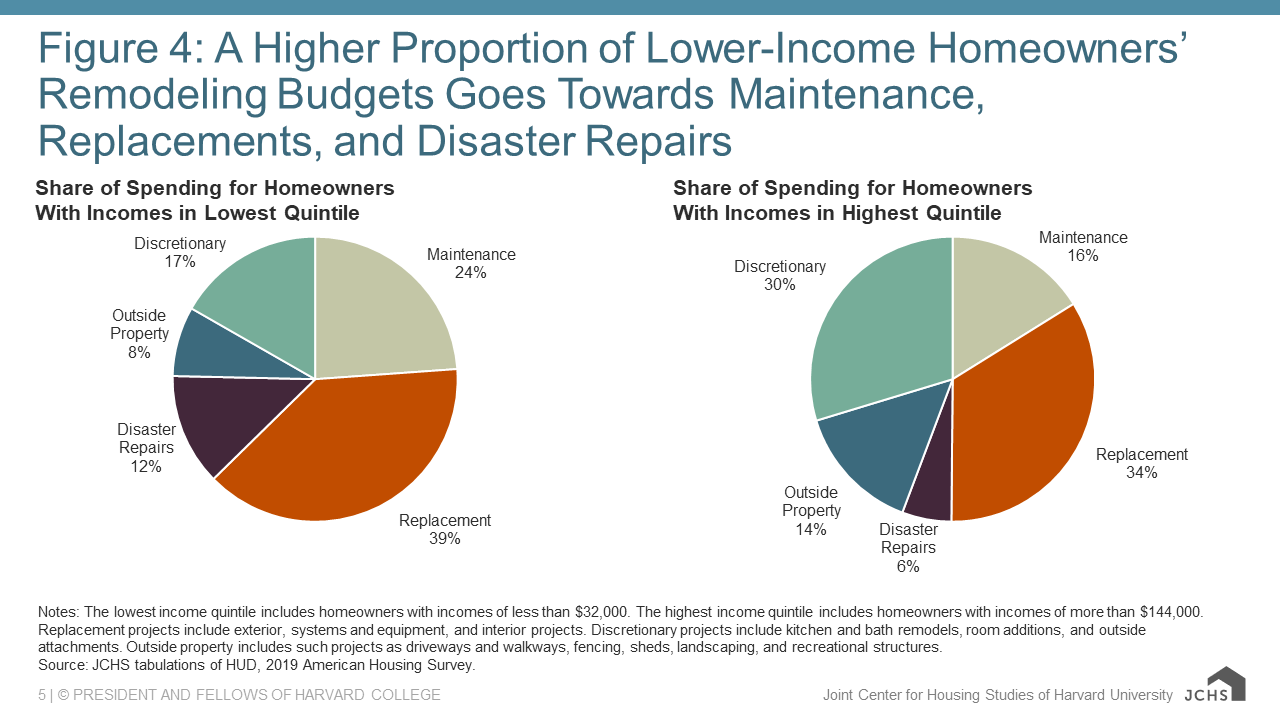
Notes: The lowest income quintile includes homeowners with incomes of less than $32,000. The highest income quintile includes homeowners with incomes of more than $144,000. Replacement projects include exterior, systems and equipment, and interior projects. Discretionary projects include kitchen and bath remodels, room additions, and outside attachments. Outside property includes such projects as driveways and walkways, fencing, sheds, landscaping, and recreational structures.
Source: JCHS tabulations of HUD, 2019 American Housing Survey.
In contrast, higher income homeowners devoted 30 percent of their spending to discretionary projects including kitchen and bath remodels and room additions, nearly double the 17 percent share for lower-income homeowners. They also spent more of their budgets on outside property improvements such as landscaping, fencing, driveways and walkways, and recreational structures.
The high cost of home maintenance and improvements puts a strain on lower-income household finances and may limit their opportunities to build wealth. A study of low-income recent homebuyers found that around a third of these households faced repair costs they could not afford, threatening the financial stability of new homeowners. Due to longstanding discrimination in education and the labor market, homeowners of color have lower median incomes than white homeowners. As a result, homeowners of color were disproportionately likely to report very little or no spending on home improvement projects in 2019, limiting households’ opportunities to build wealth by undertaking remodeling activities that increase the value of their homes.
When homeowners are unable to cover costs for routine home maintenance, let alone critical replacements, they may risk living in unsafe or unsuitable housing conditions. In 2019, 6.3 percent of lower-income homeowners, or 997,000 households, were living in homes classified as structurally inadequate by HUD due to severe structural deficiencies or the absence of basic features such as plumbing, electricity, or heat. A 2019 analysis by the Federal Reserve Bank of Philadelphia and PolicyMap estimated that a third of owner-occupied homes had unmet repair needs resulting from structural deficiencies; damage from leaks and mold; broken electrical, heating, or plumbing; or pests, with an average cost to repair of $3,142 per unit.
Meeting the repair needs of lower-income homeowners will require investment by public and nonprofit programs that subsidize home repairs for households with limited resources. HUD’s Community Development Block Grant Program (CDBG) and HOME Investments Partnership Program both provide grant funding to state and municipal governments for critical repairs and replacements to homes occupied by low-income households. The 2021 Infrastructure Investment and Jobs Act added an additional $3.5 billion investment in the Department of Energy’s Weatherization Assistance Program, which funds weatherization and energy efficiency retrofits for lower-income households. Public and nonprofit investments in home repairs and essential upgrades are critical for closing the gap between the housing conditions of highest- and lowest-income homeowners, as well as preserving the nation’s affordable housing supply.