Headlines from the 2019 State of the Nation’s Housing Report
In the course of preparing our annual State of the Nation’s Housing report, we identify several especially noteworthy trends and data points. Because the report covers such a broad range of issues, these results are not easily captured under a single headline. Therefore, here are ten headlines that struck me as particularly notable findings from this year’s report.
1. The slow rebound in construction has resulted in a nationwide shortage of housing
While household growth has rebounded back to levels from the 1990s and early 2000s, construction activity in 2018 remained less than that of any year from 1982 through the downturn in 2008. This has meant that for the last eight years, construction of new units has only equaled household growth (Report Figure 1), which is important because construction generally needs to exceed household growth by 30 percent or more to not only accommodate household growth but also to replace the roughly 250,000 units per year lost to demolition, account for second homes, and ensure a stable vacancy rate. For a few years, excess vacancies left over from the mid-2000s boom were able to cover for the lack of new construction, but now markets are tight and vacancies are at their lowest levels in decades.
Report Figure 1
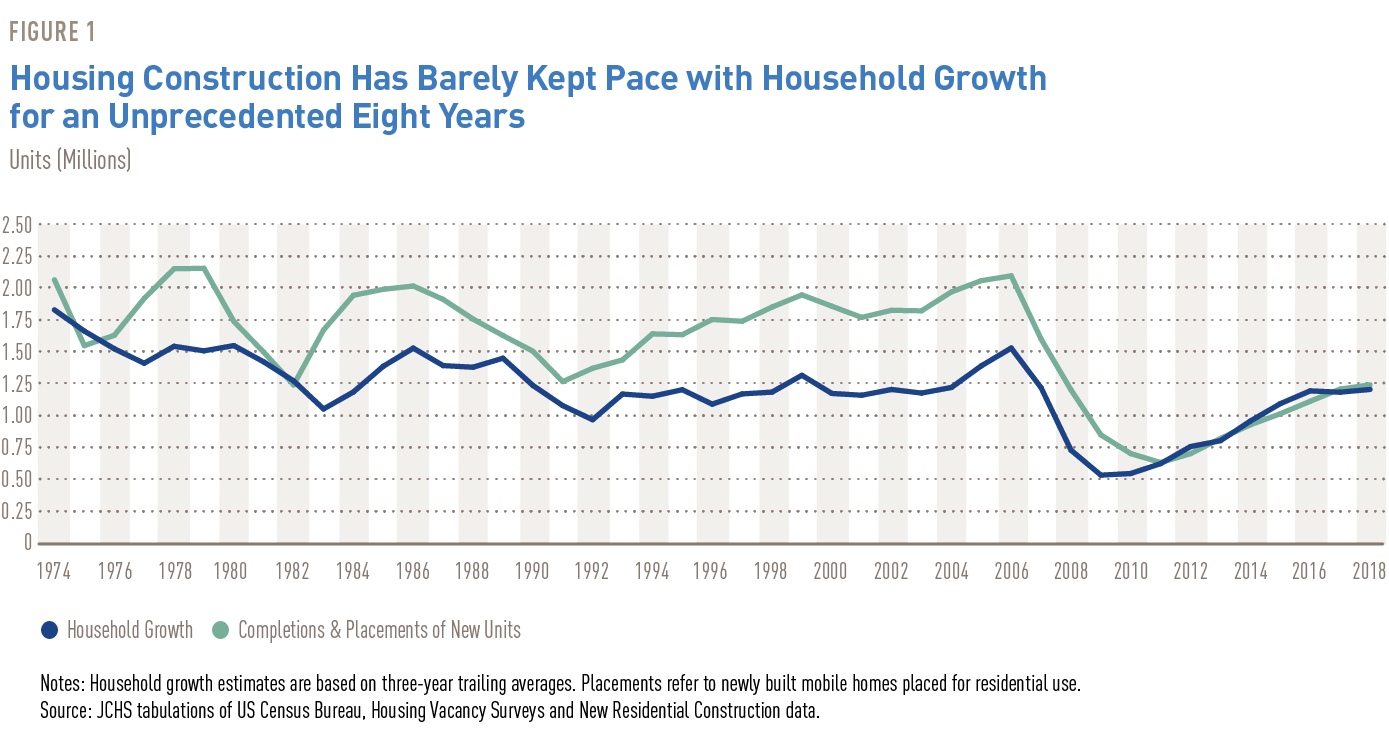
Notes: Household growth estimates are based on three-year trailing averages. Placements refer to newly built mobile homes placed for residential use.
Source: JCHS tabulations of US Census Bureau, Housing Vacancy Surveys and New Residential Construction data.
2. Housing affordability continues to be a key challenge
In 2017, over 38 million households — or nearly a third (31 percent) of all households in the US were considered cost-burdened because they spent more than 30 percent of their incomes on housing. Additionally, roughly 18 million households (15 percent) were severely cost burdened because they spent over half their incomes on housing. Burden rates were highest for renters: nearly half (47 percent) of all renter households were cost burdened and nearly one in four (24 percent) were severely burdened. Although cost-burden rates have fallen from post-recession highs, the number of cost-burdened households is still up by 6.3 million (20 percent) since 2001.
3. Cost burdens are no longer just a problem for low-income renters
Since peaking in 2011, the renter cost-burden rate has fallen by 3.3 percentage points, from 50.7 to 47.4 percent. However, rates are on the rise for nearly all income groups. Growth was particularly large for moderate- and middle-income renter households (Report Figure 4). For example, in 2011-2017, burden rates were up 4.6 percentage points among renters earning $30,000-$45,000 (in constant dollars), while rates rose 2.9 percentage points for those earning between $45,000 and $75,000. Moreover, since 2001, cost-burden rates for renters earning $45,000-$75,000 have nearly doubled, rising from 13 percent in 2001 to 25 percent in 2017. With high costs of housing affecting a broader segment of the population, addressing the issue of housing affordability is increasingly part of policy discussions taking place across the nation.
Report Figure 4
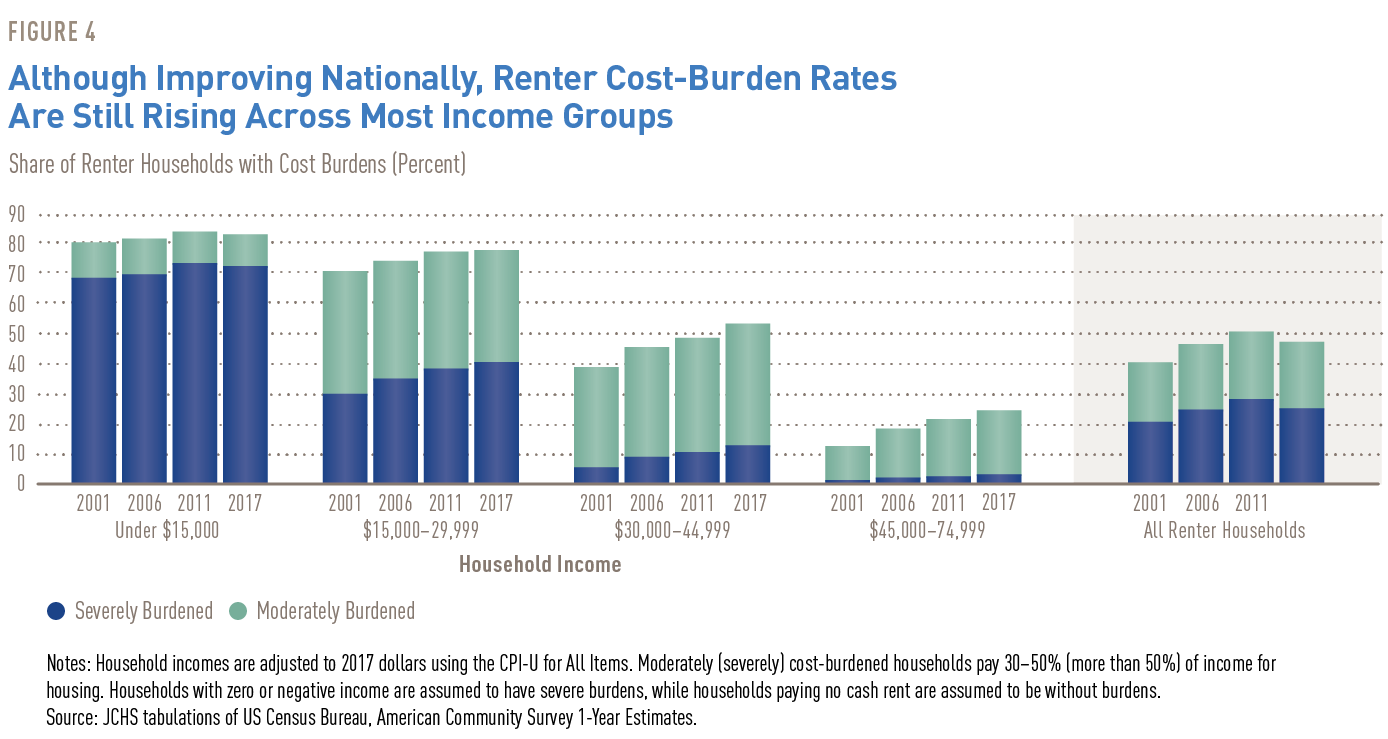
Notes: Household incomes are adjusted to 2017 dollars using the CPI-U for All Items. Moderately (severely) cost-burdened households pay 30-50% (more than 50%) of income for housing. Households with zero or negative income are assumed to have severe burdens, while households paying no cash rent are assumed to be without burdens.
Source: JCHS tabulations of US Census Bureau, American Community Survey 1-Year Estimates.
4. Millennials drove new household growth, although many are still living with their parents
In total, the number of households headed by people age 25-34 has been increasing by roughly 200,000 per year since 2015, a figure that is only now reflecting the population growth at this age group that began nearly ten years earlier (Report Figure 13). But high shares of adults in their 20s and 30s are still living with parents or are doubling up, especially in the most expensive metros with the highest rents. In fact, the share of 25-34 year olds living in their parents’ or grandparents’ homes hit a new high of 22.8 percent in 2017, which was nearly double the 12.1 percent rate in 2000. Recent trends in young adult households therefore do not reflect a decline in living with parents and doubling up, but simply a slowing of these trends to the point where population growth in this age group is driving up the number of young adult households.
Report Figure 13
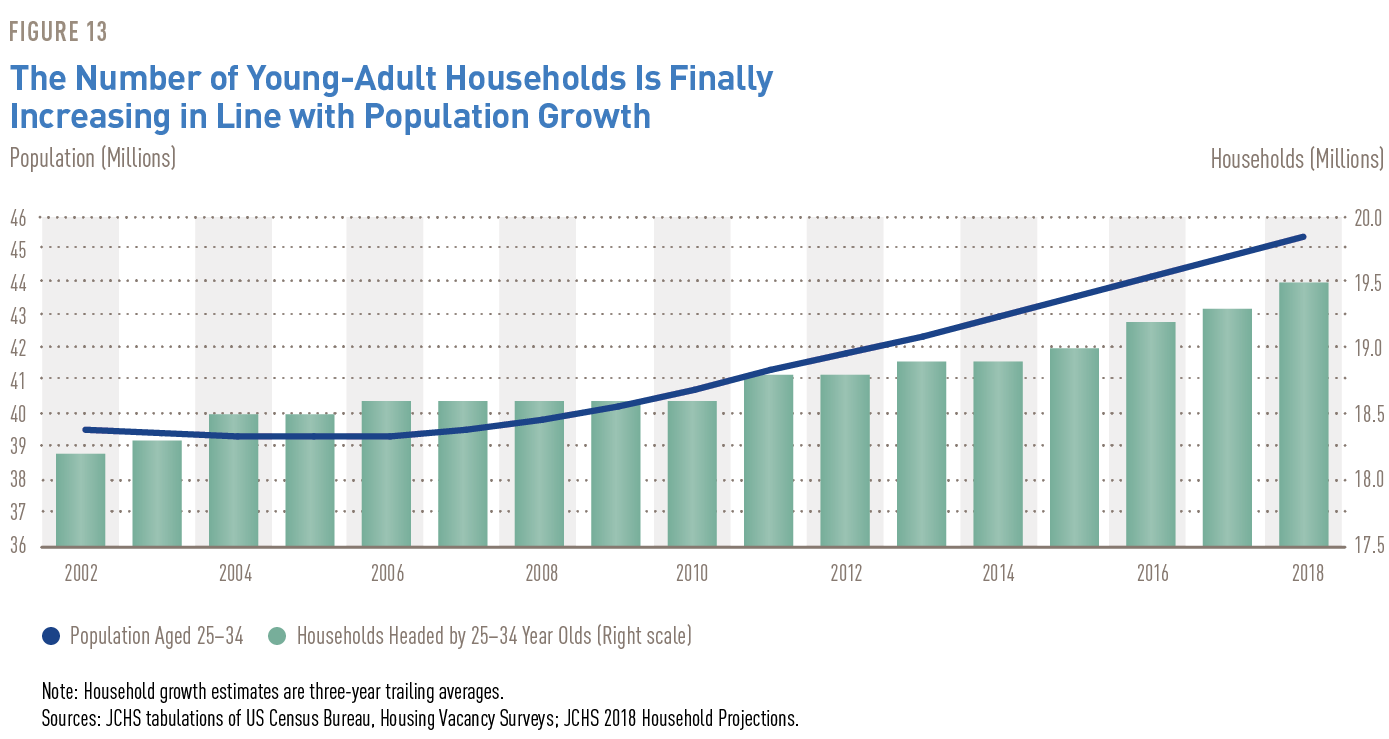
Note: Household growth estimates are three-year trailing averages.
Sources: JCHS tabulations of US Census Bureau, Housing Vacancy Surveys; JCHS 2018 Household Projections.
5. Demand for homeownership has returned but the black-white homeownership gap widened
With the addition of well over a million new homeowner households, homeownership was up in 2018. Since hitting bottom in 2016, the US homeownership rate has increased by a full percentage point, rising from 63.4 to 64.4 percent. Signaling an increase in first-time homebuying, the sharpest rise in homeownership rate (1.7 percentage points) was among adults under age 35. However, increases were not equal across race/ethnicity. Most notably, the homeownership rate for black households rose by only 0.7 percentage points, while that for whites rose by 1.1 percentage points. As a result, the gap between black and white homeownership rates is higher than it has been in at least three decades.
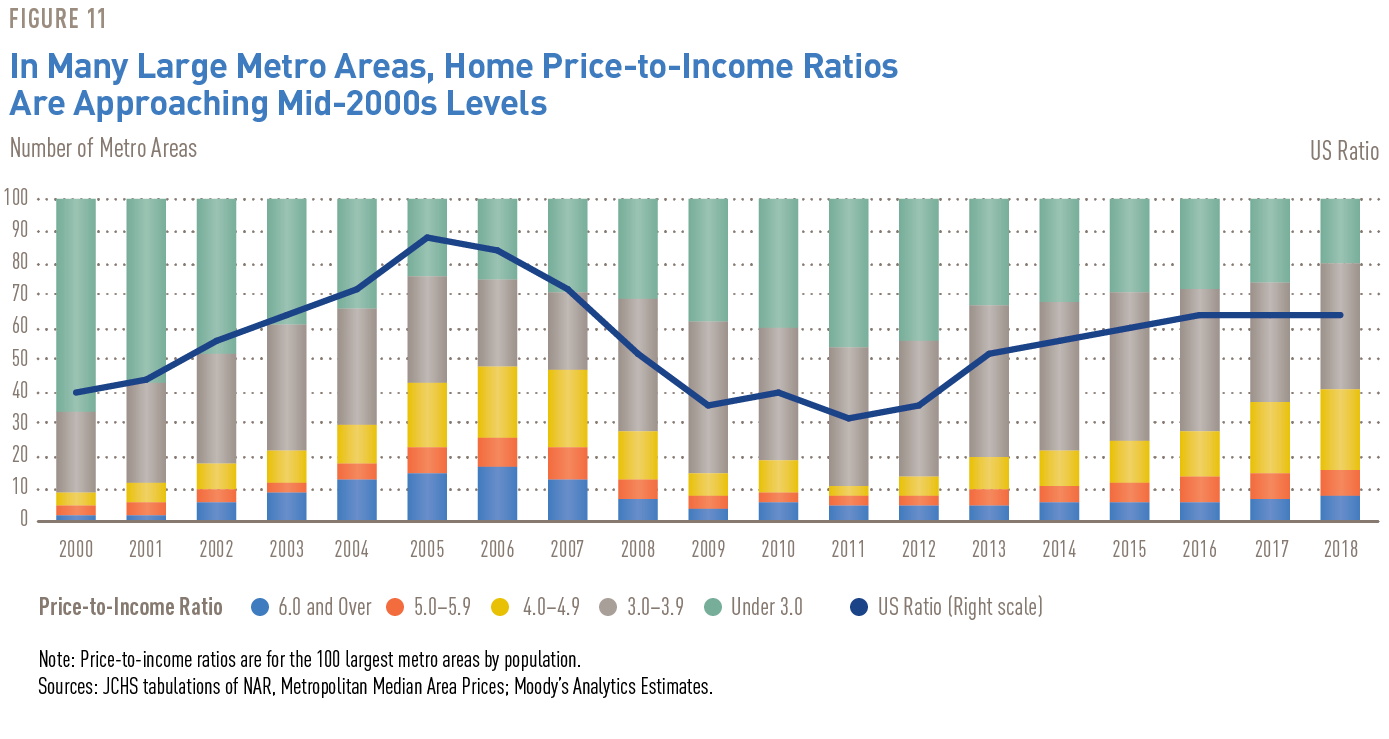
6. Home prices are rising faster than incomes
Although real median household incomes rose by 17 percent between 2011 and 2017, real median home prices rose by 42 percent in that time. As a result, price-to-income ratios across the country are back to levels from the mid-2000s (Report Figure 11). In fact, these ratios are higher than they were during the housing boom in one-third of the largest metros, including Denver, San Jose, Nashville, and Atlanta. Home prices were driven up in part by substantial increases in residential land values, which were up by 27 percent nationally between 2012 and 2017. While the largest increases in land prices occurred in Western states, such as Nevada (158 percent), Colorado (96 percent), and California (88 percent), the highest median land prices generally were found in Eastern states.
Report Figure 11
Notes: The 10 lowest- (highest-) cost metros are in the bottom (top) decile of the 100 largest metros for median home values in 2018, based on Zillow estimates. Non-metro prices are weighted averages of all state non-metro prices, with each state’s value weighted by the share of detached single-family homes.
Sources: JCHS tabulations of FHFA, All-Transactions House Price Index; Zillow median home values.
7. In many metros, very few homes are affordable to the typical renter
Interest rates on the 30-year fixed rate mortgage, which began 2018 at an average of 3.95 percent, had risen to 4.94 percent by the middle of November. As a result, even though the median home price was only up 3 percent, a new owner’s monthly housing costs for median priced home were up by 8 percent for the year. Combined, these rising costs have pushed the median-priced home well beyond what the median household could afford in several metros – leaving only small shares homes affordable to the typical household. And in 63 metros (including New York, Boston, Seattle, Denver, and Portland) the median renter household could afford less than a quarter of recently sold homes. Leading this list was Los Angeles, where less than 6 percent of recently sold homes were affordable to the median renter.
8. Although overall rental demand declined, pressures at both the high and low end kept rental markets tight
As more households became homeowners, the overall number of renter households declined in 2018. However, by many indicators rental markets remained stable nationally over the past year. At the high end, it was a story of strong demand. Even though the total number of renters declined in 2018, the number of high-income renter households grew significantly, which drove up rents, drove down vacancy rates, and sustained demand for multifamily construction. In the institutionally owned apartment sector (typically higher-end units), net apartment lease-ups actually outpaced growth in apartment units. At the low end, by contrast, it was a story of diminishing supply. Indeed, the supply of low-cost rental units has shrunk dramatically. The number of units renting for under $800 per month dropped by 1 million nationally in 2017 alone and by 4 million in 2011-2017. These declines, which occurred in three-quarters of all US metro areas, tightened markets and exacerbated affordability problems for low-income renters across the country.
9. For the first time in seven years, the number of people experiencing homelessness rose
After falling for seven consecutive years, the number of people experiencing homelessness edged up by 0.3 percent in 2018. The increase was driven by a rise in the unsheltered homeless population, which rose by 2.3 percent over the past year and is now up by 12.2 percent since 2015. The increases were particularly notable in several high-cost Western states, such as California, where unsheltered homelessness rose by 25 percent between 2014 and 2018 – an increase of 18,000 people. Addressing the current rise will require a targeted strategy with consistent funding to sustain and further previous improvements that have targeted and reduced homelessness among veterans, families, and chronically homeless individuals over the past decade.
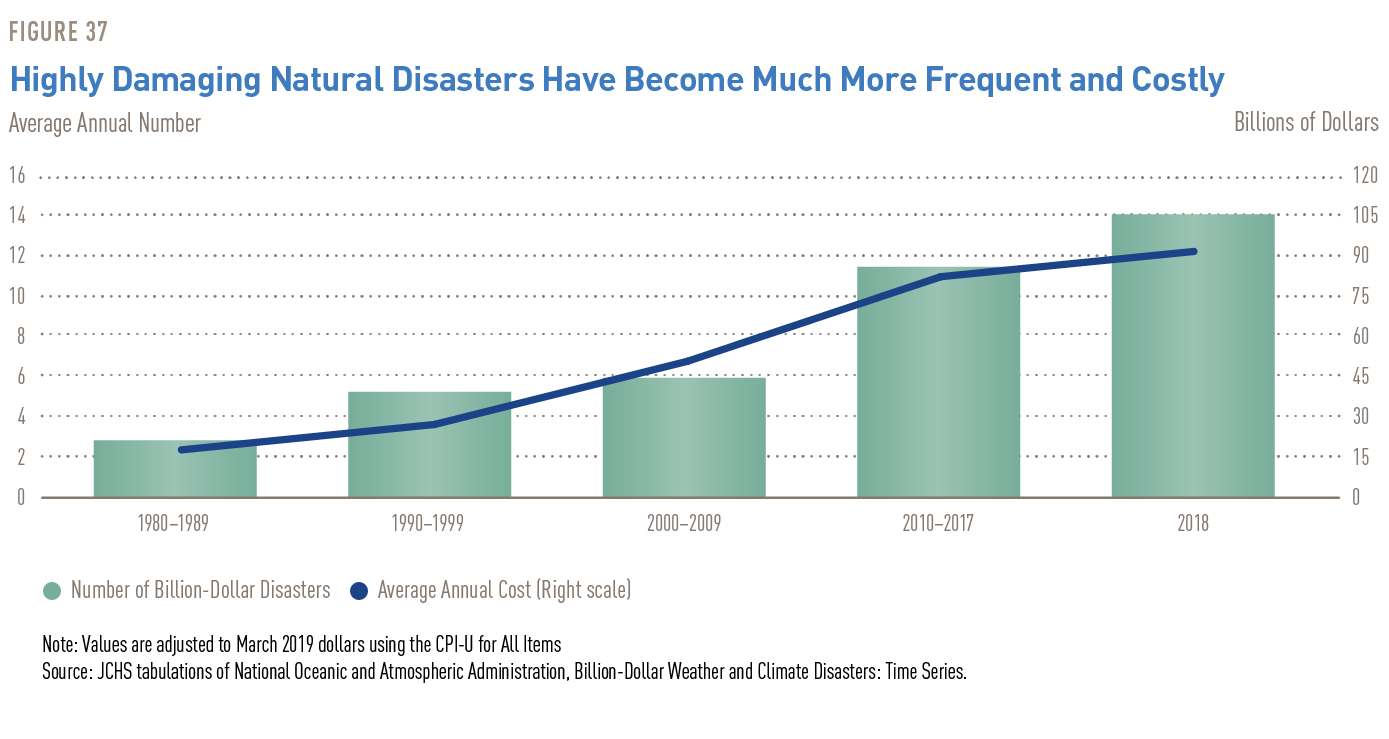
10. Highly damaging natural disasters are getting more frequent and costly
The number of highly damaging natural disasters has been growing, and the costs of these disasters is rising (Report Figure 37). According to NOAA, there were 14 natural disasters in 2018 that caused at least $1 billion in damage, following 16 such events in 2017, which combined is more storms in two years than occurred throughout the entire 1980s. In addition to causing physical and emotional harm to the population, these damages are also taking a significant financial toll on homeowners. According to our tabulations, homeowner outlays for disaster-related improvements have doubled in real terms from $7 billion per year in the late 1990s to $14 billion per year so far in the 2010s. Given the significant affordability challenges and financial constraints many households already face, finding the resources to adapt and strengthen the current housing stock, to mitigate future damage, as well as to fix the damage done by these increasingly likely storms is an urgent housing challenge for the nation.
Report Figure 37