
Five Major Findings in the 2021 State of the Nation’s Housing Report
Our annual State of the Nation’s Housing report aims to encapsulate a year’s worth of trends and issues in housing policy, market trends, household growth and composition, homeownership, affordability issues, rental markets, and more. The breadth of issues covered in the report always makes it difficult to come up with a single headline to fully describe the contents of the report, so this blog attempts to present five major findings from this year’s report that could easily have been headlines themselves.
1. The Inventory of Homes for Sale Is at Historical Lows
By December of 2020, there were just 1.03 million homes for sale. Measured by months of supply (how long it would take for homes on the market to be sold at the current sales rate), the inventory of homes for sale was just 1.9 months, which puts it below 2.0 for the first time since recordkeeping began in the 1980s. As of April 2021, there were still just 2.4 months of supply, or 1.16 million homes for sale nationwide. Historically, a balanced market has been defined as 6.0 months of available inventory, which has not occurred in the US since 2011.
Figure 1: Inventories of Homes for Sale Fell to a Record Low in Early 2021
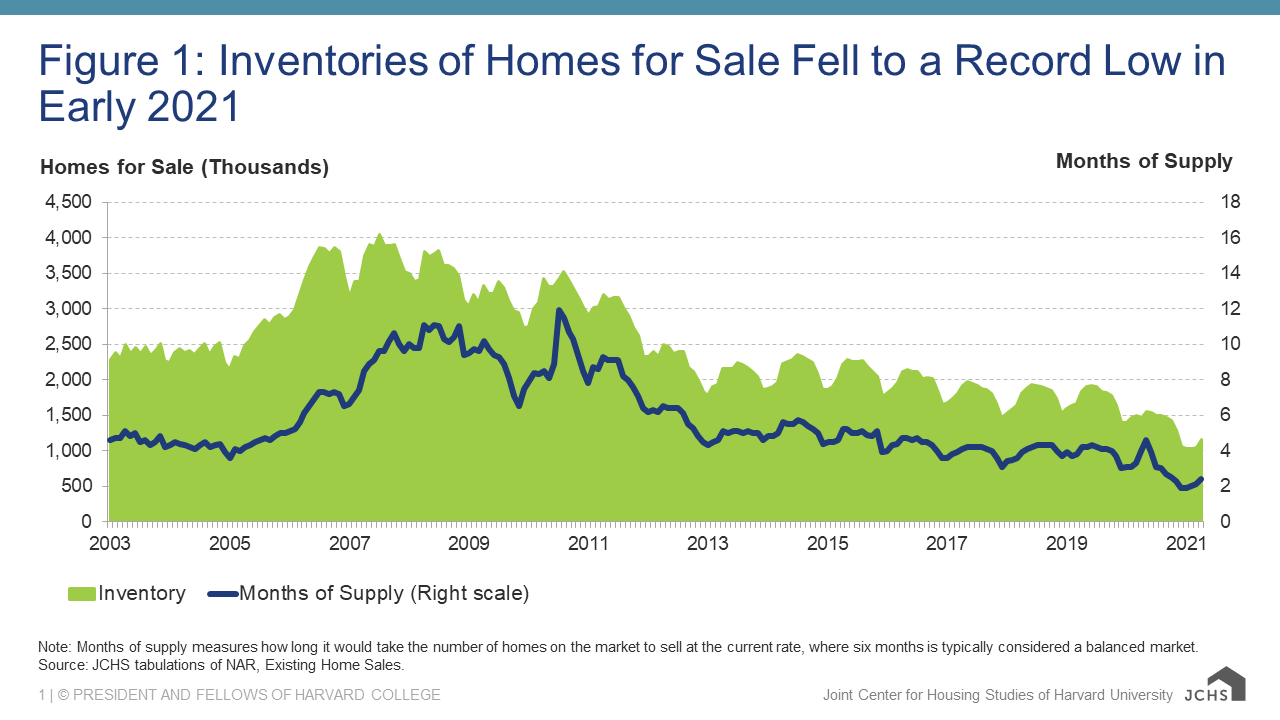
Note: Months of supply measures how long it would take the number of homes on the market to sell at the current rate, where six months is typically considered a balanced market.
Source: JCHS tabulations of NAR, Existing Home Sales.
2. Home Prices Are Rising Rapidly
Since mid-2020, home prices have been rising at an accelerating pace. Back in June of 2020, prices were rising at a modest annual rate of 4 percent, but by March of 2021, prices were over 13 percent higher than a year earlier. And in the first quarter of 2021, home prices were up by double digits in 85 of the 100 large markets. Home prices were up more than 20 percent over the past year in some metros, such as Boise (28 percent) Austin (23 percent), and Tacoma (22 percent).
Figure 2: With Inventories at Record Lows, High Homebuyer Demand Is Pushing Up Home Prices Rapidly
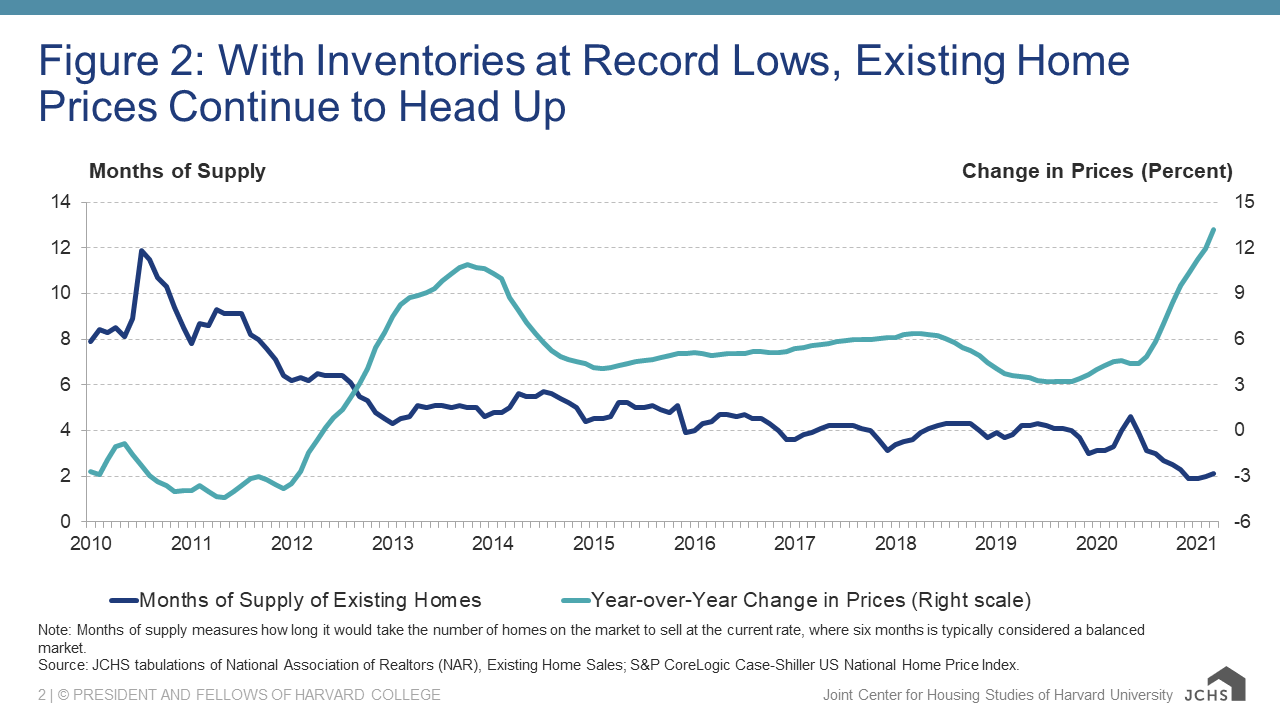
Note: Months of supply measures how long it would take the number of homes on the market to sell at the current rate, where six months is typically considered a balanced market.
Source: JCHS tabulations of National Association of Realtors (NAR), Existing Home Sales; S&P CoreLogic Case-Shiller US National Home Price Index.
3. Rents Are Down Sharply for High-End Apartments in Some High-Cost Urban Markets
High-end urban rental markets took a hit in 2020. When office work shifted to home and restaurants and entertainment venues closed during the pandemic, apartment demand in central urban areas declined. Increased interest in homeownership also hit the high-end rental market during the pandemic as higher-income renters were most able to take advantage of low interest rates to buy homes. Meanwhile, housing construction continued as an essential service during the pandemic and added a substantial amount of high-end supply in many high-cost markets. As a result, rents are down sharply over the past year in several high-cost markets such as San Francisco (-20 percent), San Jose (-16.5 percent), New York (-15 percent), and Boston (-8 percent). Rent declines appear limited to high-end units, however, as lower-quality unit rents remained on the rise throughout 2020, highlighting the continued tightness of markets as experienced by renters with modest incomes. In early 2021, rent growth in urban rental markets rebounded and will likely continue to recover as more in-person activities resume.
Figure 3: Rents in Several High-Cost Markets Were Down Substantially as of Early 2021
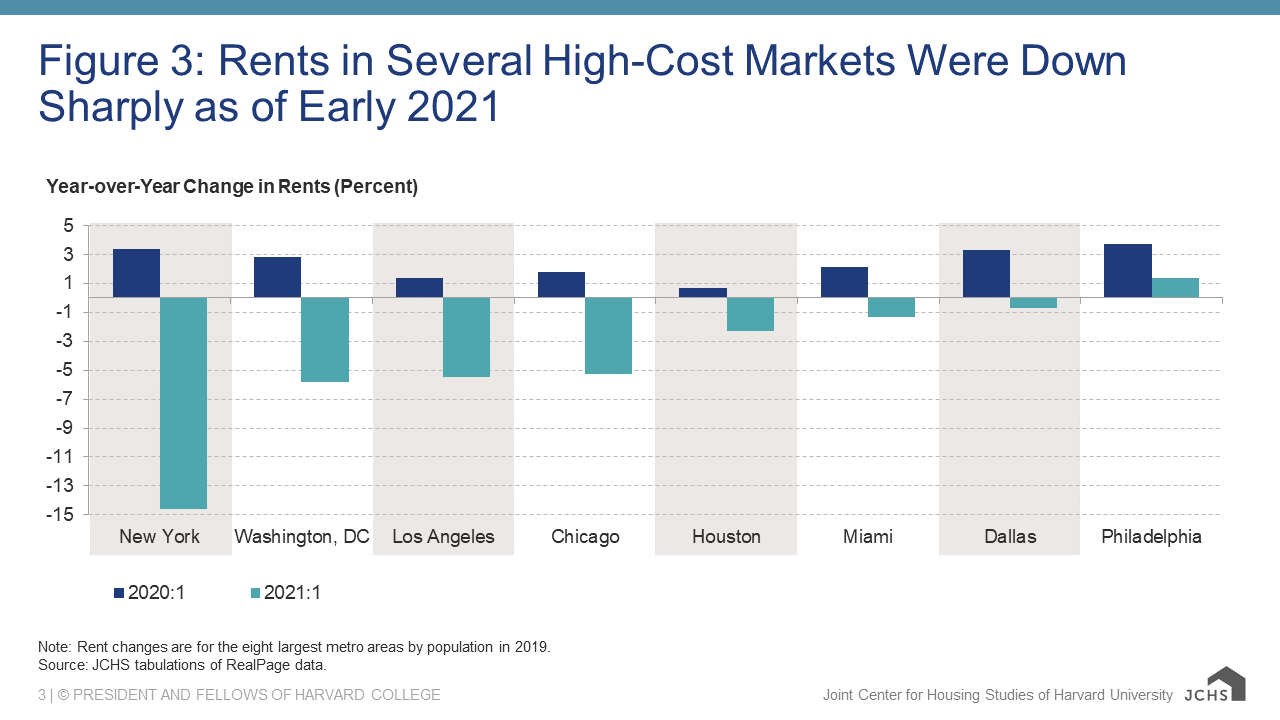
Note: Rent changes are for the eight largest metro areas by population in 2019.
Source: JCHS tabulations of RealPage data.
4. Renters and People of Color Fared the Worst During the Pandemic
Significant amounts of financial stress remained among households through early 2021, and most measures of financial stress show that renters and people of color have fared worst during the pandemic. In the first quarter of 2021, 17 percent of all renter households reported being behind on rent. Shares rise to 21 percent for Hispanic renters and fully 29 percent of Black renter households, which is nearly three times the 11 percent share reported among white renters. Getting the roughly 7 million renter households in arrears caught up on housing payments before eviction moratoriums expire will be a growing concern in the coming months for tenants, landlords, and policymakers alike.
Measurable levels of distress remain among homeowners as well, with 9 percent of all owners reporting being behind on mortgage payments early this year. Racial disparities exist here, too, as over 16 percent of Black, Hispanic, and Asian homeowners were behind on mortgage payments, which is more than double the 7 percent share among white homeowners. People of color are also disproportionately represented in the nearly 2 million homeowners in forbearance in early 2021 who will be at risk of foreclosure when forbearance periods expire in the coming months.
Figure 4: Households of Color and Renters Are More Likely to Have Fallen Behind on Monthly Housing Payments
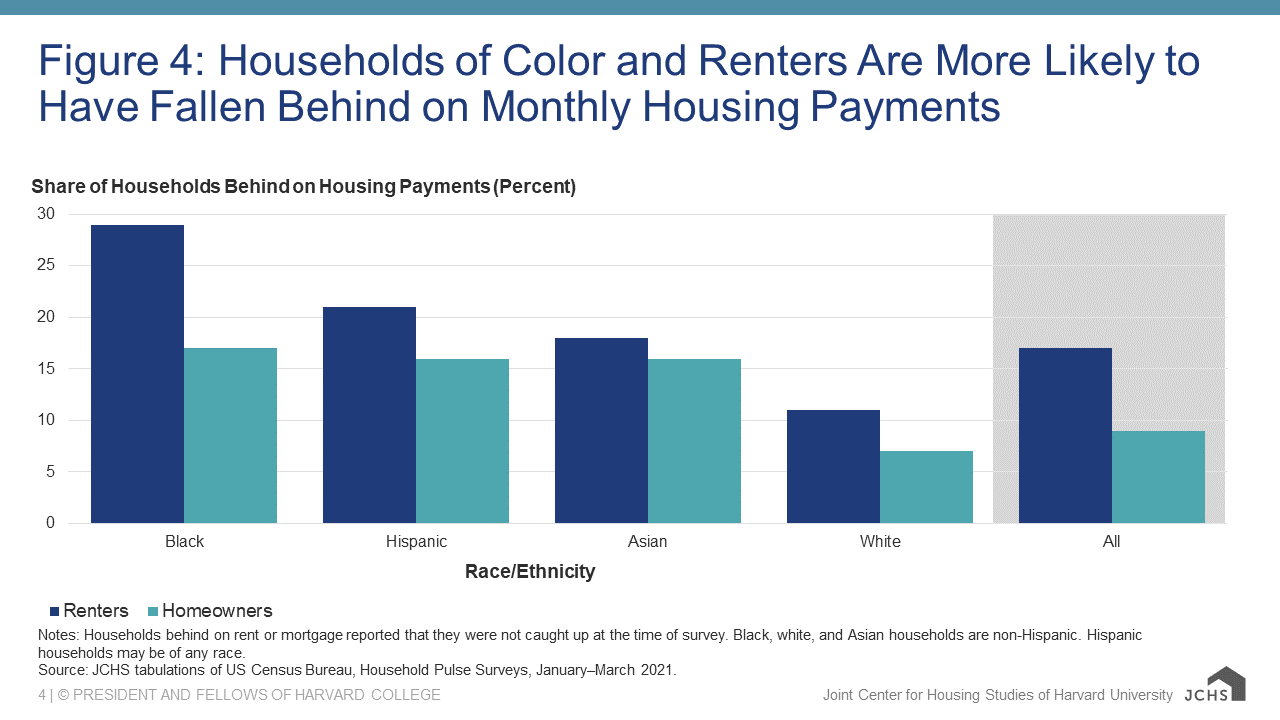
Notes: Households behind on rent or mortgage reported that they were not caught up at the time of survey. Black, white, and Asian households are non-Hispanic. Hispanic households may be of any race.
Source: JCHS tabulations of US Census Bureau, Household Pulse Surveys, January–March 2021.
5. A Growing Number of People Are Experiencing Unsheltered Homelessness
The headline-grabbing numbers related to the hot housing markets may have overshadowed the growing problem of housing security and homelessness highlighted in this year’s report. After declining for several years over the last decade, the number of people experiencing unsheltered homelessness grew in 2020 for the fifth year in a row, and is now up by 50,000 people since 2015. And this measurement was taken prior to the pandemic. With persistently high rates of housing cost burdens making it difficult for millions of low-income households to pay rent even when fully employed and nearly impossible to build emergency savings to cover periods of lost income, our report describes how housing security remains tenuous for millions of lower-income households despite the easing of the pandemic’s impacts.
Figure 5: The Number of People Experiencing Unsheltered Homelessness Climbed Again in 2021
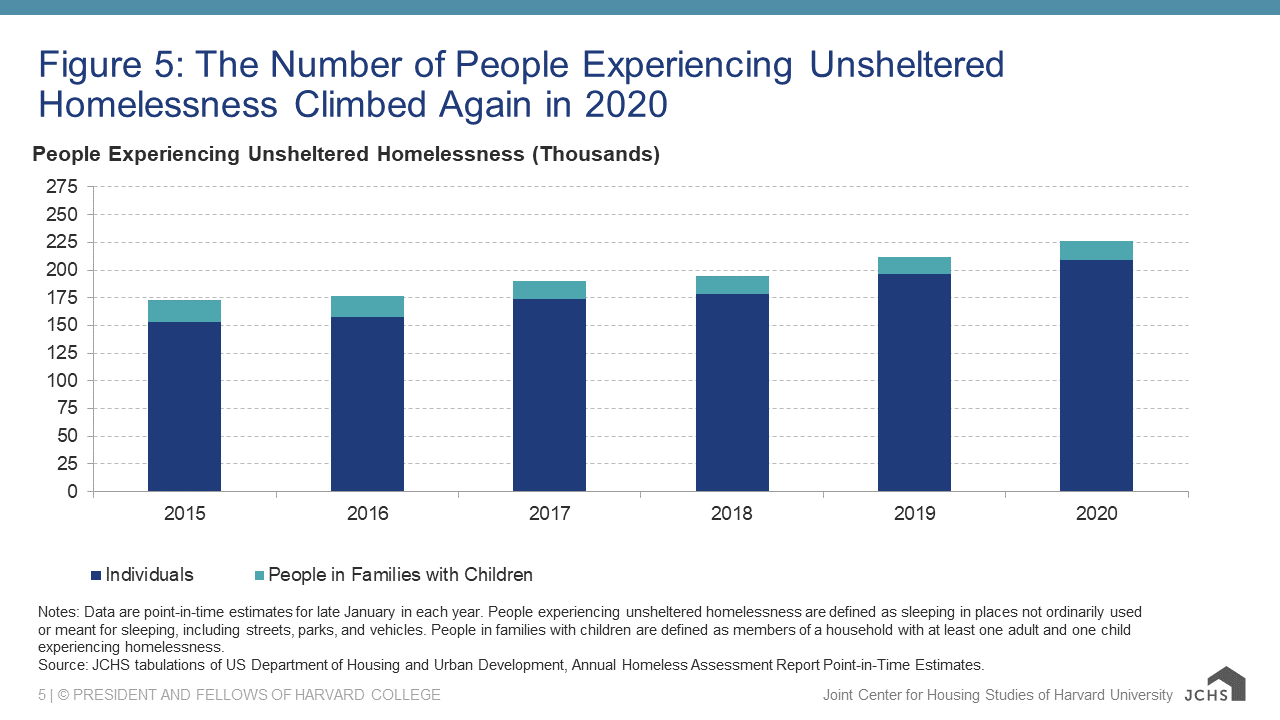
Notes: Data are point-in-time estimates for late January in each year. People experiencing unsheltered homelessness are defined as sleeping in places not ordinarily used or meant for sleeping, including streets, parks, and vehicles. People in families with children are defined as members of a household with at least one adult and one child experiencing homelessness.
Source: JCHS tabulations of US Department of Housing and Urban Development, Annual Homeless Assessment Report Point-in-Time Estimates.