8 Facts About Investor Activity in the Single-Family Rental Market
Single-family rentals have long been an important part of the US housing stock. But according to our latest State of the Nation’s Housing report, investor purchases of single-family homes reached new heights during the pandemic, particularly lower-cost units and homes in Sunbelt markets. While many of these units are eventually resold to new buyers, most are rented out to tenants. Moreover, there have been significant changes in who owns single-family rentals over time. Most notably, a growing share of rental properties are owned by business entities and medium- and large-scale rental operators. Examining investor activity in the single-family rental market over the past two decades reveals eight key facts:
1. Single-family rentals have long been a substantial part of the rental stock
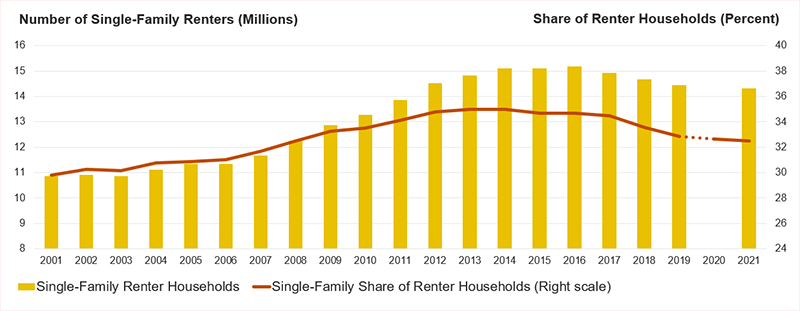
There were 10.9 million renters living in single-family homes in 2001, just under 30 percent of all renters (Figure 1). Following the Great Recession of the mid-2000s, the number of single-family rentals grew significantly, peaking at 15.2 million in 2016, as investors took advantage of the flood of distressed home sales during the foreclosure crisis. The number of single-family rentals then fell in more recent years as the for-sale market strengthened, and many of these homes converted back to owner occupancy. By 2021, there were 14.3 million single-family renter households, comprising about 33 percent of all renters. Despite the more recent declines, there were still 3.5 million more single-family renters compared to two decades earlier.
Figure 1: Single-Family Homes Have Long Been an Important Part of the Rental Stock; Increased Significantly Following the Housing Crisis
2. Investor activity in the single-family market increased significantly since the start of the pandemic
According to CoreLogic, investors who owned 3 or more homes simultaneously at some point in the prior decade began to purchase an elevated share of single-family homes during the pandemic, as interest rates fell to historic lows and rents climbed to historic highs. Indeed, the share of single-family homes purchased by investors averaged a steady 16 percent share in the three years immediately preceding the pandemic from 2017-2019. But investor activity then rose quickly in 2021 before peaking at 28 percent of sales in the first quarter of 2022. Investor activity moderated through early 2023 but remained well above the levels from 2019, even as owner-occupant home purchases fell below pre-pandemic levels. As a result, investors still purchased 27 percent of single-family homes in the first quarter of this year.
3. Investors are most likely to purchase lower-cost homes
In the fourth quarter of 2022, investors purchased nearly one-third of homes sold in the bottom third by metro area sales price compared to about one-quarter of homes that sold in the top third. Investors have the potential to exacerbate the already extremely limited inventory of homes for sale, especially entry-level homes for first-time and moderate-income homebuyers, as well as in markets where investors are most active.
4. Investor activity is especially pronounced in Sun Belt markets with strong rent and population growth
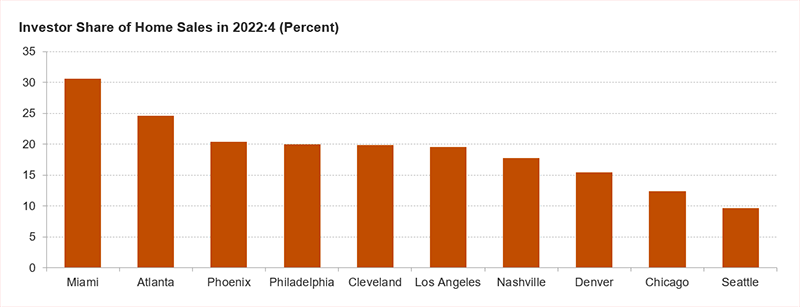
According to data from Redfin, investors purchased nearly one-third of homes sold in Miami (31 percent) in the fourth quarter of 2022 and about one-quarter in Jacksonville (27 percent) and Atlanta (25 percent) (Figure 2). While investor activity is generally lower in the Northeast and Midwest, investors still purchased one-fifth of homes in markets like Philadelphia and Cleveland. These represent a continuation of longer-term trends. Large single-family operators have especially concentrated portfolios. According to a recent study from the Urban Institute, investors who own at least 1,000 homes have 45 percent of their single-family holdings in six markets: Atlanta, Phoenix, Dallas, Charlotte, Houston, and Tampa.
Figure 2: Investor Activity Is Especially Concentrated in Select Markets in the South and West
5. Investor activity increased for investors of all sizes since the start of the pandemic, though much of the growth was driven by large investors
During the pandemic, investor activity grew for investors of all sizes, but especially for small (3-10 properties) and large-scale investors (1,000 or more properties), according to CoreLogic, whose holdings increased most and have remained highest relative to the same period in 2019.
6. Rental property ownership is shifting away from individual ownership toward more ownership by business entities
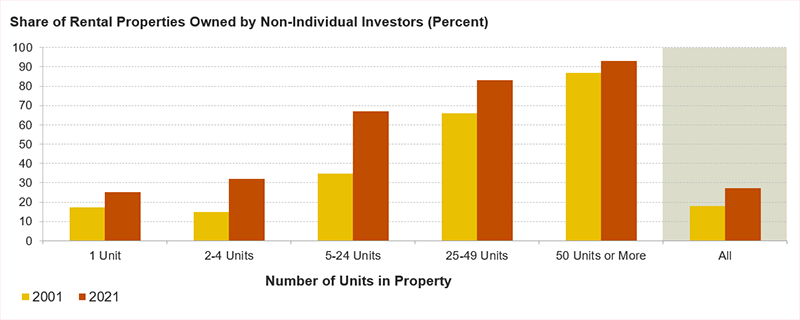
According to our tabulations of the Rental Housing Finance Survey, the share of rental properties owned by non-individual investors increased from 18 percent in 2001 to 27 percent in 2021 (Figure 3). Non-individual investors include limited partnerships, limited liability corporations, trustees for estate, real estate corporations, and Real Estate Investment Trusts, among other corporate entities. The growth in non-individual ownership has been greatest for small- and midsized- multifamily properties but was also evident for single-family rentals. Indeed, 25 percent of single-family rentals were owned by non-individual investors in 2021, up from 17 percent two decades earlier. This explains how investor activity in the single-family housing market has increased even as the number of single-family rentals has declined in more recent years.
Figure 3: Non-Individual Investors Own a Growing Share of Rental Properties
7. Large rental operators own a small share of the single-family rental stock
According to one estimate by Adam Travis tabulating Zillow ZTRAX data for 2018, investors with at least 1,000 properties owned just 2 percent of small rental properties (single-family homes and multifamily structures with 2-4 units), though 12 percent of properties owned by some corporate entity. By comparison, micro investors or mom and pop landlords with 1-2 units owned two-thirds (66 percent) of all small rental properties.
8. Single-family rental construction hit record highs during the pandemic
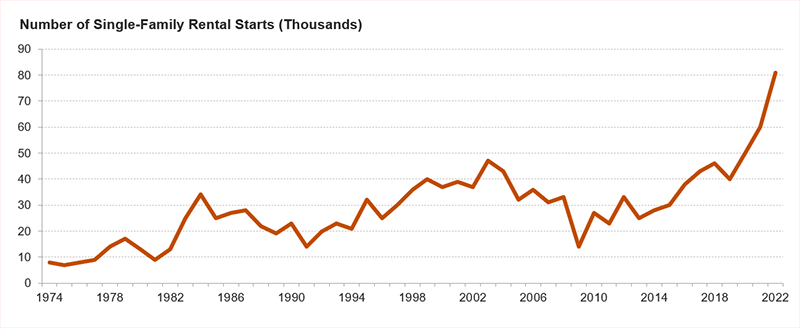
According to Census Bureau estimates, 81,000 single-family rental homes were started in 2022, 8 percent of single-family starts and an all-time high surpassing even the 60,000 units started a year earlier (Figure 4). These numbers represent a lower-bound estimate of the single-family construction market, because they do not account for homes that are sold to a buyer and immediately rented out to tenants. The National Association of Home Builders, for example, estimates that an additional 5 percent of single-family housing starts are likely intended for the rental market. The growth in single-family rental construction and the rise in investor activity are driven by some of the same underlying market forces. Demand for single-family living increased during the pandemic and has been sustained by the aging of the large millennial cohort into its 30s and 40s—peak homebuying years but also the age many households form families. At the same time, rising interest rates and home prices have made homebuying less affordable, making single-family rentals an attractive option to many households priced out of homeownership.
Figure 4: Single-Family Built for Rent Hit Record Highs in 2022
Increased investor activity in the housing market has led to growing policy concerns in recent years. Investors may crowd out owner-occupant homebuyers, especially in Sun Belt markets where investors are most active. Some large investors have also been associated with aggressive management practices, leading to higher eviction rates and larger rent increases. On the other hand, because of their size and capacity, large single-family rental operators can provide higher value and cost savings to tenants through more professionalized property management and might increase access to neighborhoods that typically exclude renters. Given the continued prevalence of single-family rental housing and increased investor activity since the start of the pandemic, this important segment of the housing market remains ripe for future study.


