Benchmark Update Lowers Remodeling Market Size Projections
by Abbe Will, July 18, 2019
Our Leading Indicator of Remodeling Activity (LIRA) provides a short-term outlook of national home improvement and repair spending to owner-occupied homes and is benchmarked to national spending estimates from the US Department of Housing and Urban Development’s American Housing Survey (AHS). The latest LIRA release projects national spending for home remodeling and repairs will grow to $331 billion in 2019, an increase of 5.5 percent from last year. This LIRA release also updates and revises historical spending levels and growth due to the incorporation of new benchmark data from the recently released 2017 AHS.
Compared to last quarter’s LIRA release, the updated LIRA now shows lower market size estimates and projections for remodeling and repair activity in 2018, 2019, and the first half of 2020. According to our tabulations of the AHS, spending in 2016 and 2017 was not nearly as robust as the LIRA model predicted, growing only 5.4 percent from $278 billion in 2015 to $292 billion in 2017 compared to LIRA estimated growth of 11.9 percent over this time period. As seen in Figure 1, the lower growth in benchmark remodeling and repair spending in 2016 and 2017 has implications for the size of the market projected by the LIRA model for 2018, 2019, and 2020. (Click charts to enlarge.)
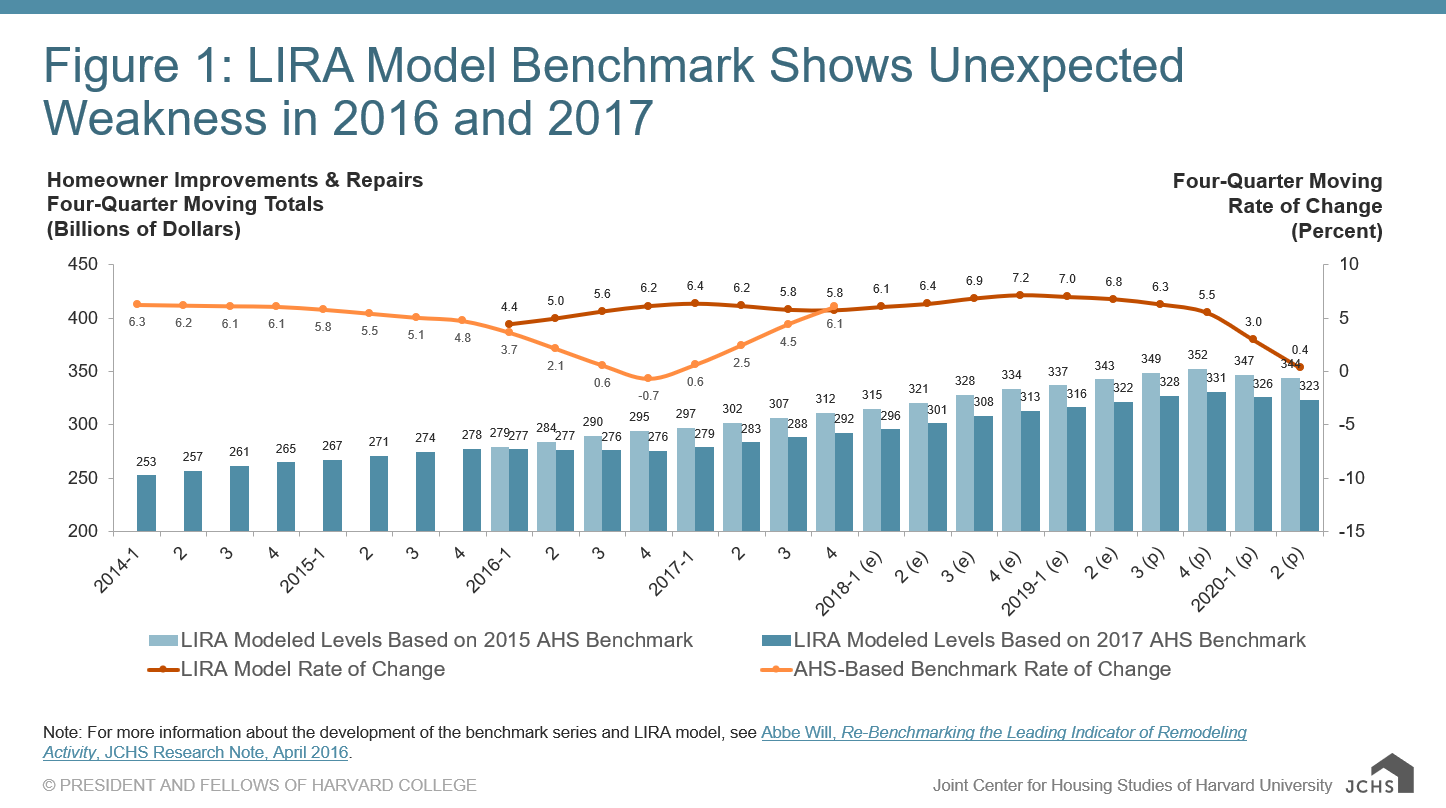
Previously, the LIRA estimated a homeowner improvement and repair market size of $336 billion in 2018 and projected that spending would grow to $353 billion in 2019. With the replacement of AHS-based benchmark data for previously modeled estimates, the LIRA model indicates remodeling activity reached $313 billion in 2018 and projects spending will reach $331 billion this year. The implication of slower growth in actual remodeling and repair spending over 2016 and 2017 is a reduction in market size projections for 2019 of 6.3 percent or $22 billion.
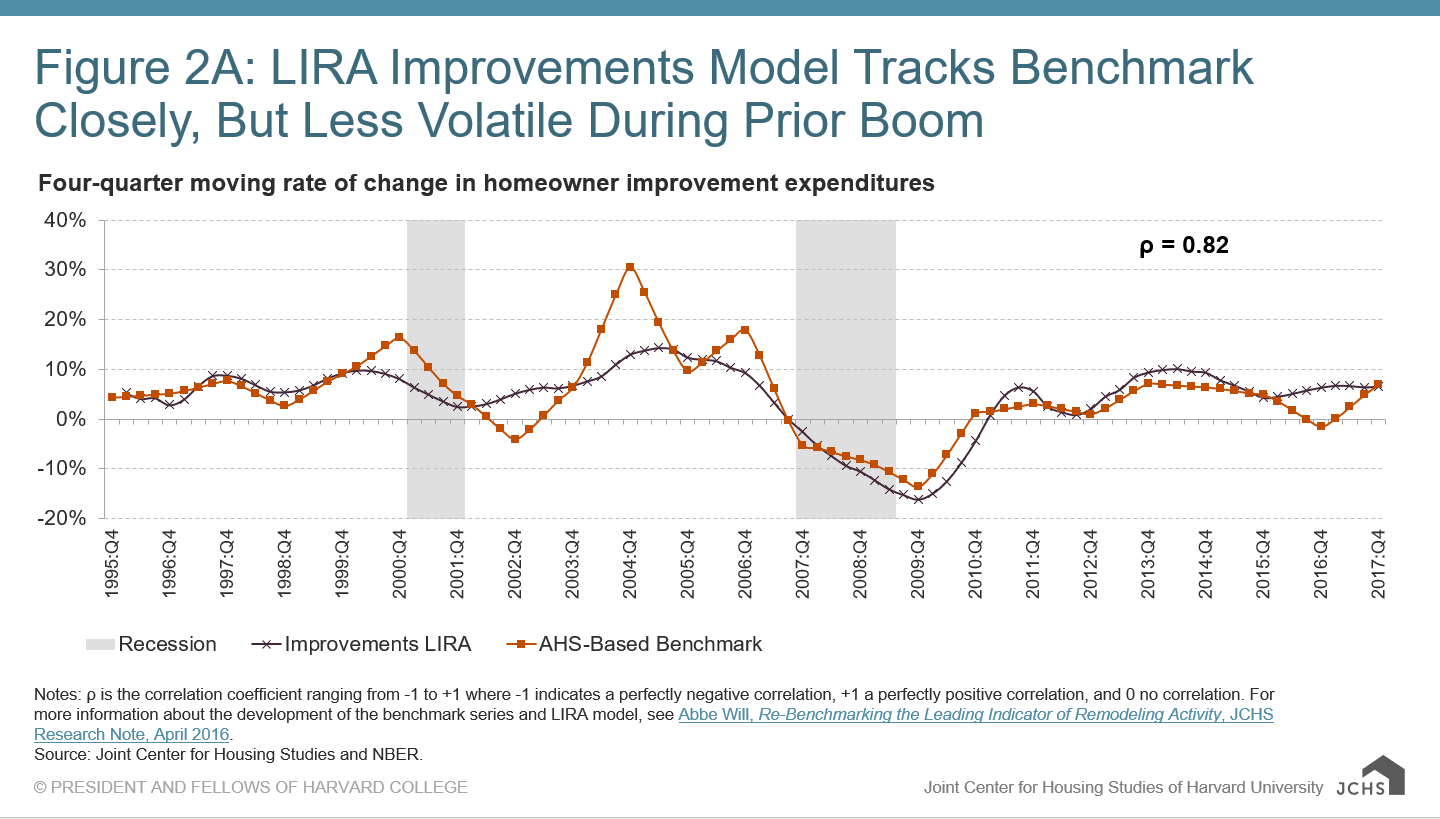
The weighted average of the LIRA inputs produces the LIRA estimates and projections as seen in Figure 2A (for modeling improvement spending trends) and Figure 2B (for modeling maintenance and repair spending trends) compared to the updated AHS-based benchmark data series for 1994–2017. Overall, the improvements LIRA tracks the reference series very closely despite the unusual deviation in 2016 and 2017 in the AHS-base benchmark series. The estimates produced by the improvements LIRA model and the AHS-based benchmark now have a correlation coefficient of 0.82 (p-value of 0.00), barely budging from the 0.84 correlation coefficient before adding in the updated benchmark data for 2016 and 2017. And a simple regression of the LIRA output on the benchmark spending series results in an R-squared value of 0.6725, which suggests that upwards of 70 percent of the variation, or movement, in the improvements spending benchmark can be explained by the LIRA model. These values are also essentially unchanged from the last time the benchmark series was updated two years ago.
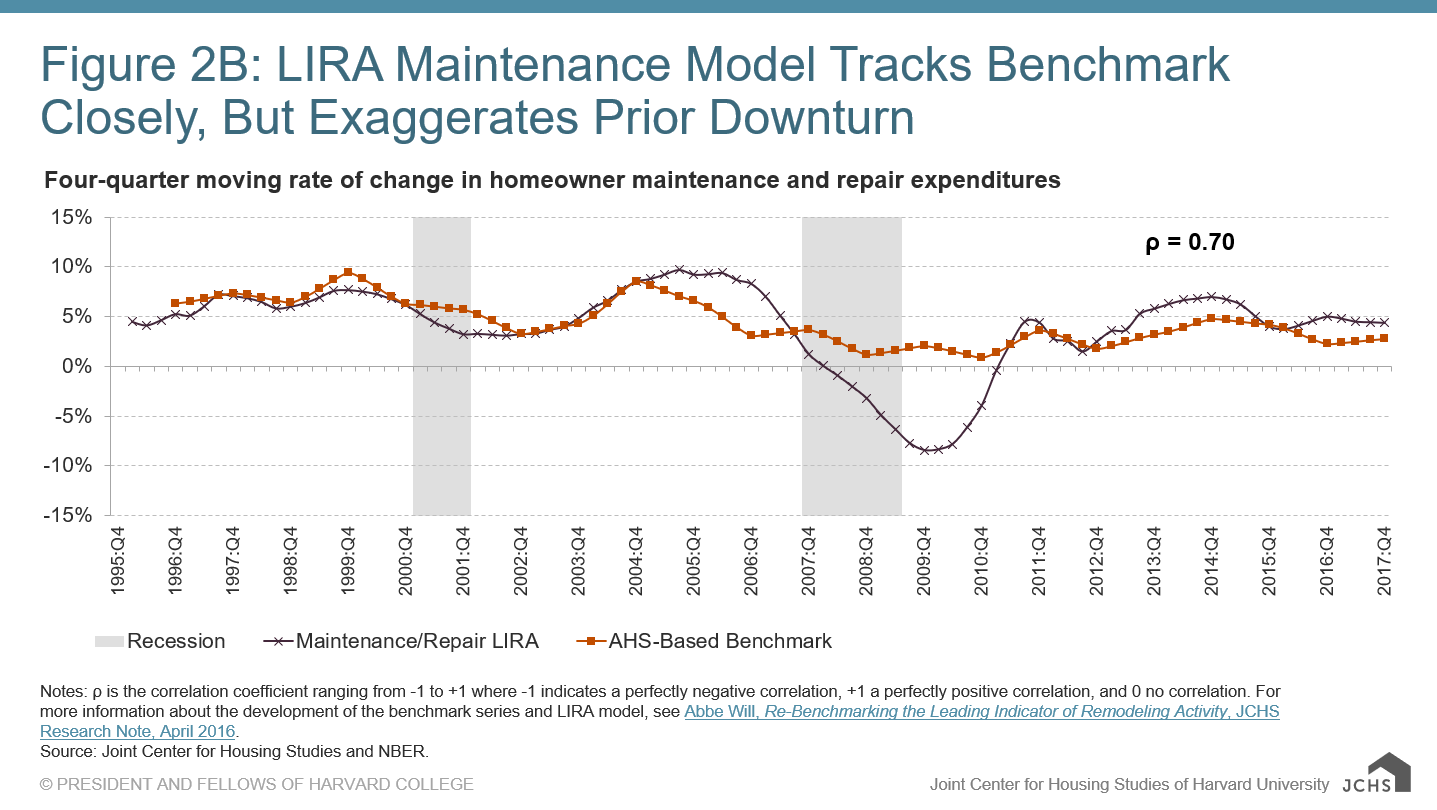
Similarly, Figure 2B compares the weighted average output of the maintenance and repair LIRA model to its AHS-based reference series. The maintenance LIRA has also tracked its benchmark fairly well historically and more so after recovering from the prior downturn. The maintenance and repair LIRA and its reference series have a correlation coefficient of 0.70 (p-value of 0.00) and a simple regression of the LIRA output on the benchmark results in an R-squared value of 0.4788, which suggests that about 50 percent of the movement in the home maintenance and repair spending benchmark can be explained by this LIRA model.
In 2016, the LIRA was re-benchmarked to a measure of home improvement and repair spending based on estimates from HUD’s biennial American Housing Survey. Once every two years, with new historical AHS data, the LIRA benchmark series will also be updated. Beginning with the July 2019 release, the LIRA model will be used to estimate historical spending levels since 2017 until the next biennial release of the American Housing Survey allows for actual 2018 and 2019 spending data to replace modeled estimates.
More detailed analysis of recent and expected trends in home improvement and repair activity is available in the latest Improving America’s Housing report released earlier this year by our Remodeling Futures Program.