
After Falling Last Year, Home Prices Are Rising Again
After home prices fell during the latter half of 2022 and markets across the country cooled, prices have been increasing nationally in 2023. Indeed, according to our analysis of the Freddie Mac House Price Index, home prices increased by 0.7 percent on a monthly basis in August, marking an eighth consecutive month of growth. The growth in prices is somewhat slower than what occurred in 2021 but, when combined with higher interest rates, is putting homeownership (and the associated wealth-building opportunities) out of reach for a growing number of households. An interactive chart released with our State of the Nation’s Housing 2023 report (and updated below) shows how this trend has played out in metro areas across the US (Figure 1).
Figure 1: Home Price Growth Has Lifted Prices
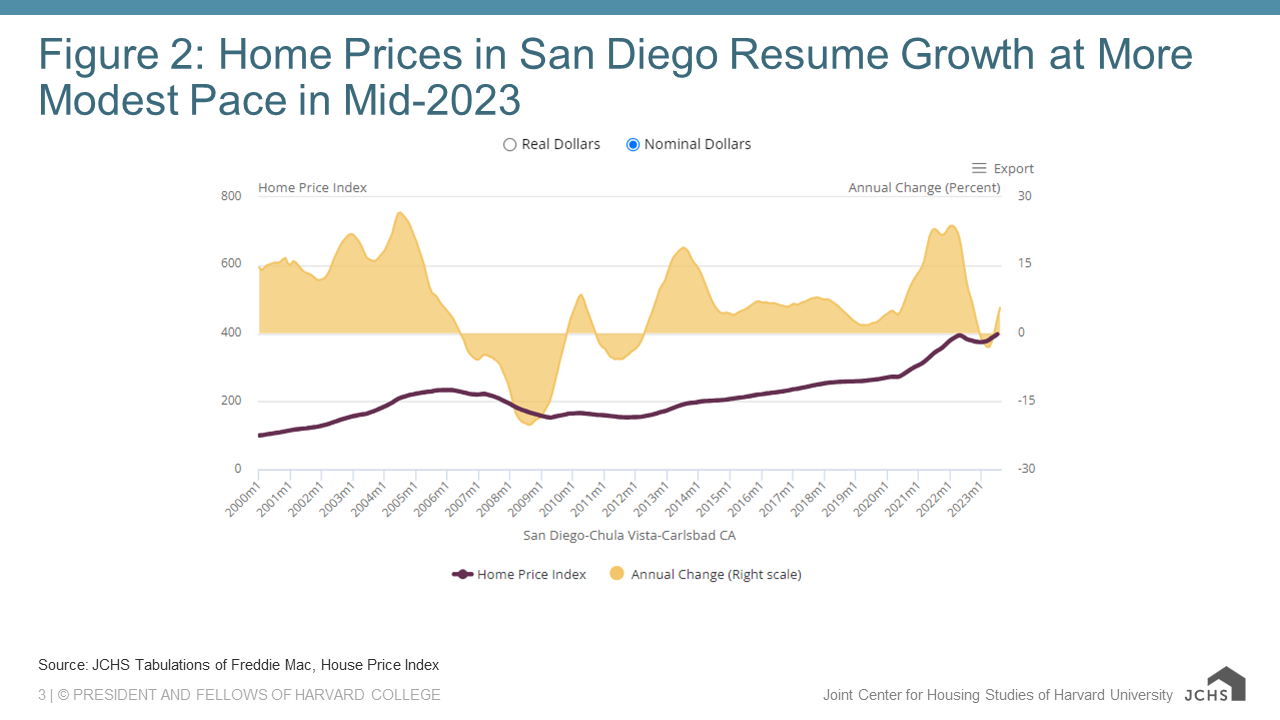
The resumption of home price growth has been widespread across the country as inventories remain constrained in most markets. In August 2023, home prices increased on a monthly basis in 93 of the 100 largest metros in the country. Prices in the Northeast markets of Rochester and Syracuse led all large markets in this growth (respectively up 1.5 and 1.4 percent), while prices in some markets in the South (McAllen up 1.3 percent) and West (San Diego up 1.3 percent) followed closely (Figure 2). This is a sharp turnaround compared to just over a year before, in July 2022, when monthly home prices increased in just 20 large markets (a low since the beginning of the pandemic). In fact, prices in nearly three-quarters of the top 100 markets grew by over 0.5 percent on a monthly basis in August 2023, while no markets saw price growth above that rate the year before.
Figure 2: Home Prices in San Diego Resume Growth at More Modest Pace in Mid-2023
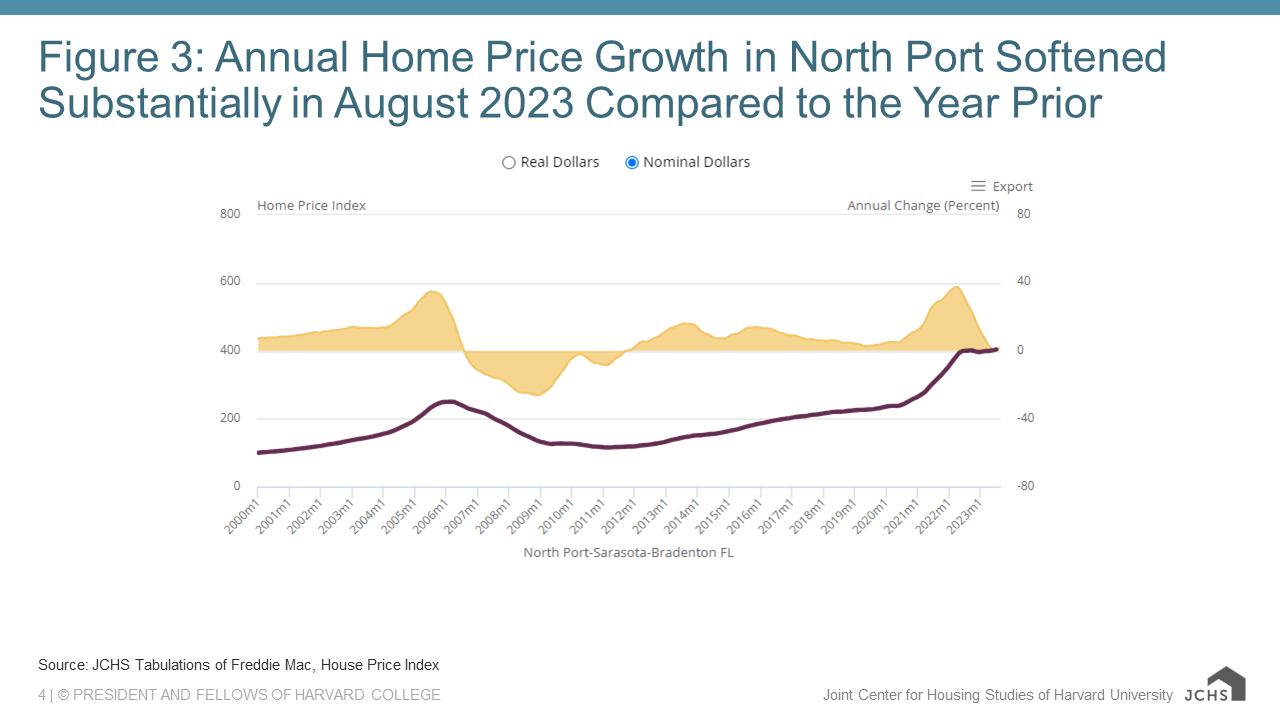
In markets where home prices rose annually in August 2023, the increases were modest compared to the exceptionally high annual growth rates of the past two years. In fact, Syracuse (12.6 percent growth), McAllen (12.3 percent), and Rochester (11.6 percent) were the only large markets with double-digit home price growth in August, compared to nearly two-thirds of 100 large markets in August 2022 and 99 markets in August 2021. More broadly, on an annual basis, as of August 2023 home prices had grown in 87 of the 100 largest markets. But in 85 of those markets, the annual home price growth rate in August 2023 was more modest than in August 2022. Softening was especially sharp in Florida markets; for example, in North Port prices rose just 1.5 percent in August 2023 compared to 27.4 percent a year earlier (Figure 3).
Figure 3: Annual Home Price Growth in North Port Softened Substantially in August 2023 Compared to the Year Prior
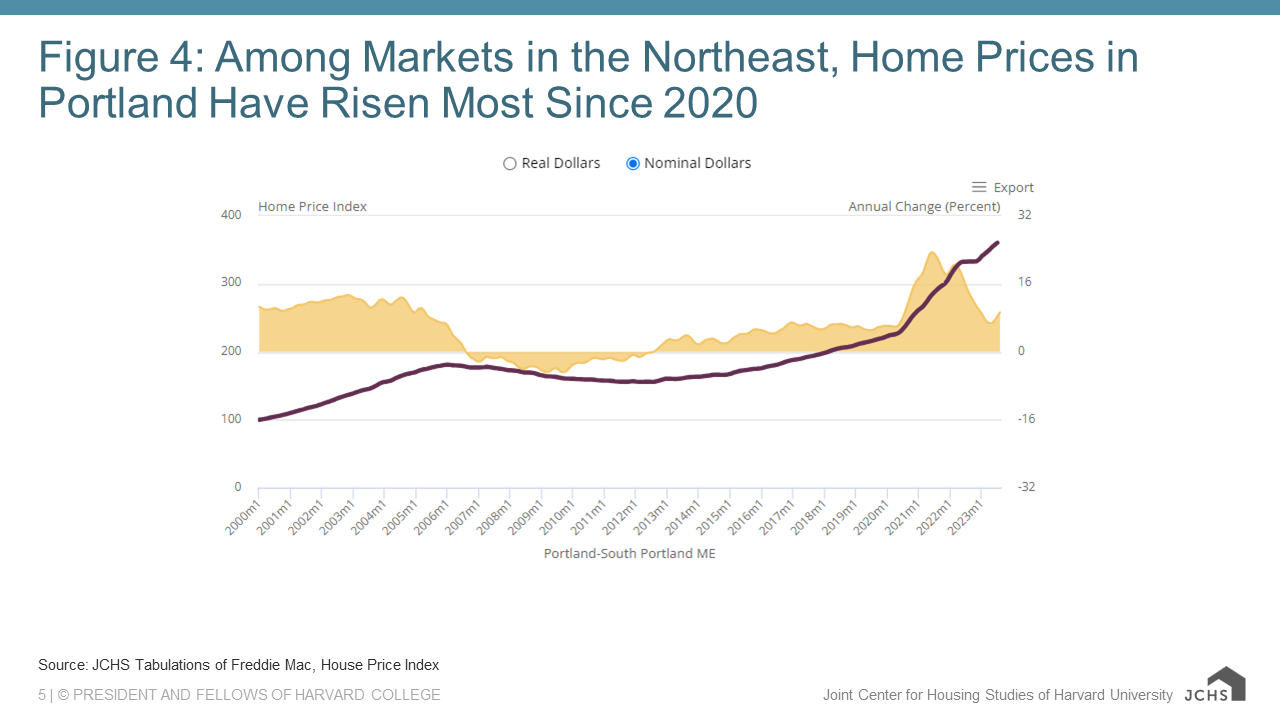
Even though markets cooled in 2022, home prices have risen substantially since the start of the pandemic in nearly every metro area. Indeed, across all 100 large markets, between February 2020 and August 2023 prices grew an average of two times as much as in the previous three and a half year period. Home prices rose the most in some Florida markets, with six metros from the state appearing in the top 10 highest-growth large markets. Prices rose the most in Cape Coral, growing 75.9 percent over this period. This is a drastic change from three and a half years prior, in February 2020, when home prices in Cape Coral grew by just 17.2 percent. Since the start of the pandemic, home prices rose most rapidly in Portland among Northeast markets (up 62.1 percent), in Tucson in the West (up 54.6 percent), and in Youngstown in the Midwest (up 49.4 percent) (Figure 4). Even in New Orleans, the metro where home price growth was slowest since the beginning of the pandemic, home prices still grew by 20.9 percent.
Figure 4: Among Markets in the Northeast, Home Prices in Portland Have Risen Most Since 2020
When combined with higher mortgage rates, elevated home prices make the prospect of homeownership unattainable for an increasing number of potential buyers. With affordability eroding, in the near term downpayment assistance programs could be a solution for mitigating barriers to homeownership for some households. In the longer term it is imperative the housing shortage be addressed through reducing local regulatory barriers to construction such as exclusionary zoning policies, and that new construction be increasingly targeted toward the middle and lower ends of the market.