
Did Housing Affordability Worsen During the First Year of the Pandemic?
For the first time in a decade, housing cost burdens worsened significantly during the first year of the pandemic, according to our analysis of new data from the US Census Bureau and reported in The State of the Nation's Housing 2022. The share of all households who spent more than 30 percent of their income on housing increased to 30 percent in 2020, up 1.5 percentage point from the prior year—the first substantial uptick in cost burdens since 2010 (Figure 1). The share of renters with cost burdens rose especially rapidly, climbing 2.6 percentage points to 46 percent. Meanwhile, cost burden rates for homeowners also rose 1.0 percentage point to 21 percent.
Figure 1: Housing Affordability Worsened in the First Year of the Pandemic
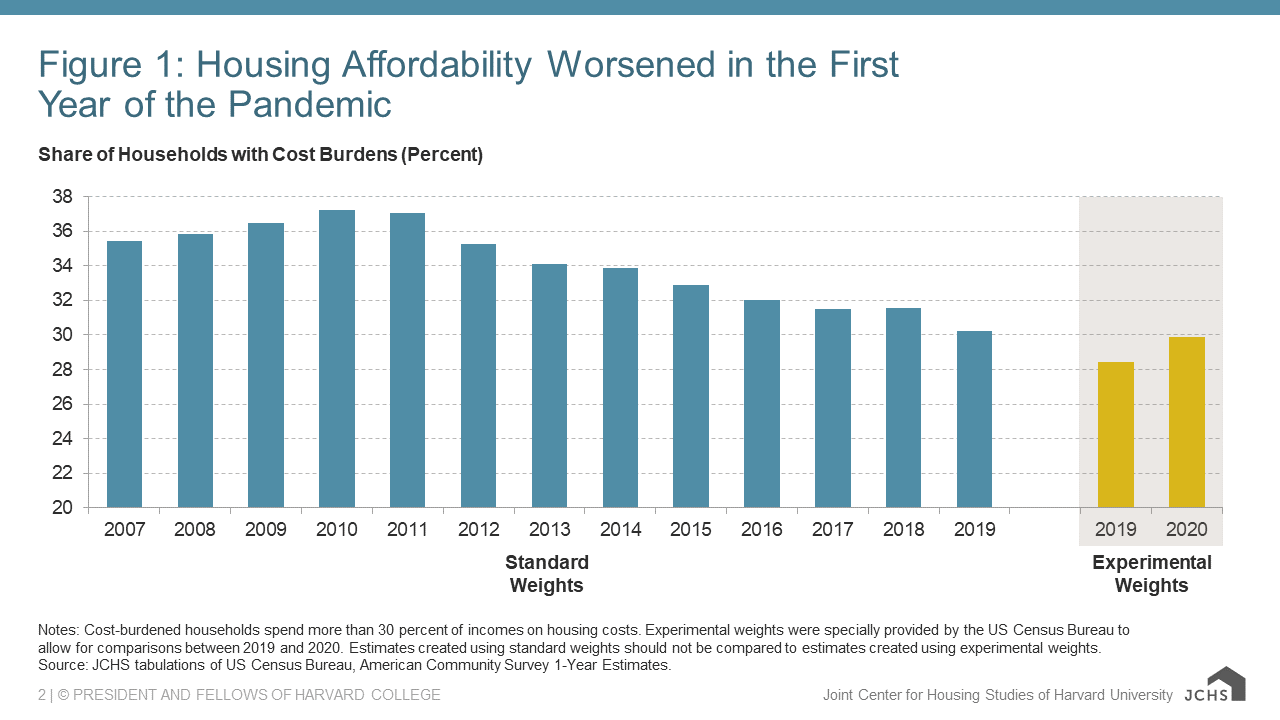
Notes: Cost-burdened households spend more than 30 percent of incomes on housing costs. Experimental weights were specially provided by the US Census Bureau to allow for comparisons between 2019 and 2020. Estimates created using standard weights should not be compared to estimates created using experimental weights.
Source: JCHS tabulations of US Census Bureau, American Community Survey 1-Year Estimates.
This first nationwide glimpse into changes in housing affordability since the start of the pandemic is possible because the Census Bureau released experimental weights for the 2019 and 2020 American Community Surveys (ACS). Fielding the 2020 iteration of this annual survey presented considerable challenges due to the pandemic. Indeed, responses to the survey declined significantly in 2020 compared to prior years as Census paused normal surveying operations. Not only did fewer people respond to the survey, but those who did had systematically higher incomes, introducing considerable nonresponse bias into the survey’s sample.
The experimental survey weights in the 2020 ACS partially address this bias by incorporating administrative and third-party data for the first time. The use of experimental weights corrected for some nonresponse bias, but at the same time rendered the 2020 ACS mostly incomparable with surveys from prior years, preventing any analysis of trends over time.
But the recent release of experimental weights for the 2019 ACS allows for direct comparisons between the 2019 and 2020 ACS by applying the same weighting methodology to both years. In other words, using the experimental weights produces a second estimate of housing cost burdens in 2019 that also incorporates administrative data to account for nonresponse bias in the same way as the 2020 ACS, and illuminates changes in some housing, economic, and demographic trends during the first year of the pandemic.
In addition to the 1.5 percentage point increase in overall cost burden rates in 2020, rising cost burdens were remarkably widespread. The share of Black households with cost burdens rose an astounding 2.4 percentage points, but burden rates also increased 1.6 percentage points for white, 0.8 percentage point for Asian, and 0.6 percentage point for Hispanic households. Likewise, the burden rate increased across all income groups. The rise was largest for middle-income households earning $30,000–44,999 at 4.2 percentage points.
Rising cost burdens in 2020 reversed a nearly decade-long trend of gradually improving affordability (Figure 2). Indeed, the cost-burden rate peaked in 2010 in the aftermath of the housing crisis and Great Recession of the mid-2000s but has inched down every year since—excepting a slight uptick in 2018—declining 7.0 percentage points by 2019 when using the standard weights. But if estimates using the experimental weights accurately capture the changes in the first year of the pandemic, the jump in cost burdens in 2020 entirely reversed the 1.4 percentage point decline in 2019 and reversed one-fifth of the improvement in the cost-burden rate over the past decade. To put this in context, in the aftermath of the Great Recession, total cost burden shares rose just 1.8 percentage point in 2008–2010.
Figure 2: Cost Burdens Increased Substantially in 2020 Following Nearly a Decade of Improved Affordability

Notes: Cost-burdened households spend more than 30 percent of incomes on housing costs. Experimental weights were specially provided by the US Census Bureau to allow for comparisons between 2019 and 2020.
Source: JCHS tabulations of US Census Bureau, American Community Survey 1-Year Estimates.
For renters, the 2.6 percentage point rise in cost burden shares in 2020 even more significantly cut into improving conditions before the pandemic (Figure 3). The 2020 increase wiped out more than half of the progress made in renter burdens over the prior eight years. Indeed, after peaking in 2011 at just under 51 percent, renter burdens declined 4.4 percentage points through 2019.
Figure 3: Housing Cost Burdens for Renters Jumped Dramatically in 2020…

Notes: Cost-burdened households spend more than 30 percent of incomes on housing costs. Experimental weights were specially provided by the US Census Bureau to allow for comparisons between 2019 and 2020.
Source: JCHS tabulations of US Census Bureau, American Community Survey 1-Year Estimates.
The 1.0 percentage point increase in the share of cost-burdened homeowners was also sizeable. However, that increase represents a retreat of just one-tenth of the progress made in homeowner burdens over the prior decade. The share of homeowners with burdens peaked at 30 percent in 2010, before retreating more than 9 percentage points by 2019 (Figure 4).
Figure 4: … While Cost Burdens for Homeowners Were Also on the Rise
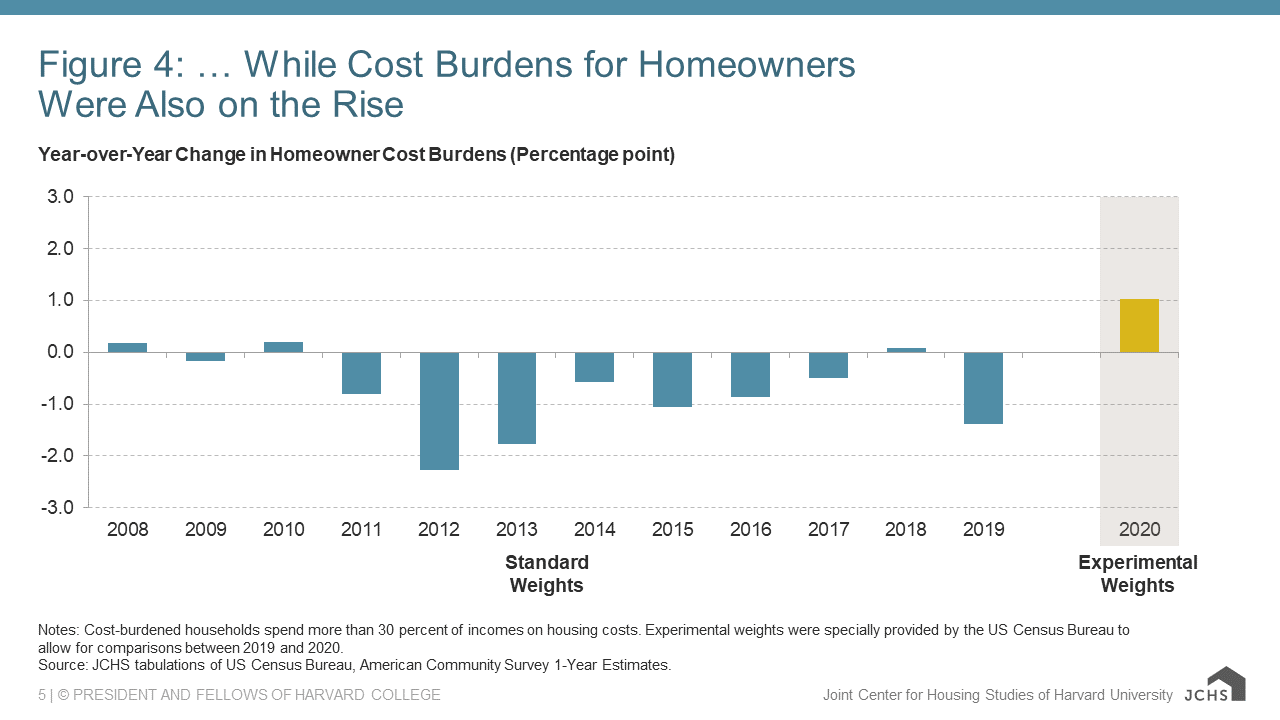
Notes: Cost-burdened households spend more than 30 percent of incomes on housing costs. Experimental weights were specially provided by the US Census Bureau to allow for comparisons between 2019 and 2020.
Source: JCHS tabulations of US Census Bureau, American Community Survey 1-Year Estimates.
The first year of the pandemic marked a significant financial shock for many households who were temporarily unemployed, cut back hours when childcare was disrupted, or missed shifts when they became ill. Despite increased unemployment insurance and federal stimulus checks, many households lost income in the face of continually rising housing costs. Whether the economic recovery since 2020 has been enough to offset rapidly rising home prices and rents remains to be seen, but the pre-pandemic affordability crisis assuredly continues.