
Have More People Moved During the Pandemic?
While the share of Americans moving each year has been falling for several decades, the start of the pandemic seemed to upend that trend. Media stories and blogs painted a picture of people moving en masse to suburbs, rural areas, and small vacation towns, having substantial effects on local housing markets. But how many Americans actually moved? And how many moves were permanent? Answering these questions is challenging because typical public survey datasets, such as the American Community Survey, have time lags. However, change-of-address requests submitted to the US Postal Service (USPS) indicate that while an unusually large number of people did move early in the pandemic and again in late 2020, there has not been a significant change from prior years in the total number of moves since the pandemic began. The data, moreover, show notable increases in the number of individuals who moved but decreases in the number of families that moved.
Anyone can set up mail forwarding through a change of address request with the USPS, which recently started reporting anonymized data of these requests. The resulting dataset reveals how many people moved into and out of different ZIP codes, but does not provide pairings that would link origins and destinations. (USPS has restricted access to their pairings data, but notable analyses of it can be found online.) When making an address change request, people must choose whether they are requesting for an individual, family, or business, and whether this move is permanent or temporary (also called seasonal moves). Requesting a change of address is not mandatory, and people might not request a change when they move or they might request a change for reasons other than moving, so the data do not represent a perfect reflection of residential mobility. Nevertheless, for ease of reference I’ll refer to these change requests as moves.
In both 2018 and 2019, there were 2–3 million temporary moves, and 31–33 million permanent moves (including individual, family, and business moves) according to USPS data. Despite sporadic spikes, moves have remained within this typical range since the start of the pandemic. There were 31.74 million permanent moves in 2019, which ticked up by one percent to 31.96 million moves in 2020. There were 26 million permanent moves from January–October 2021 (the most recent data available), which is about 800,000 fewer moves than in the same span in both 2019 and 2020. The biggest increases in permanent moves during the pandemic were in March 2020 and December 2020, both with about 300,000 more moves, which represent increases from a year prior of 12 and 14 percent, respectively (Figure 1). It is likely no coincidence that these spikes line up with the onset of the pandemic and the first winter surge in coronavirus cases.
Figure 1. Permanent Moves Ticked Up During the Onset and First Winter Wave of the Pandemic
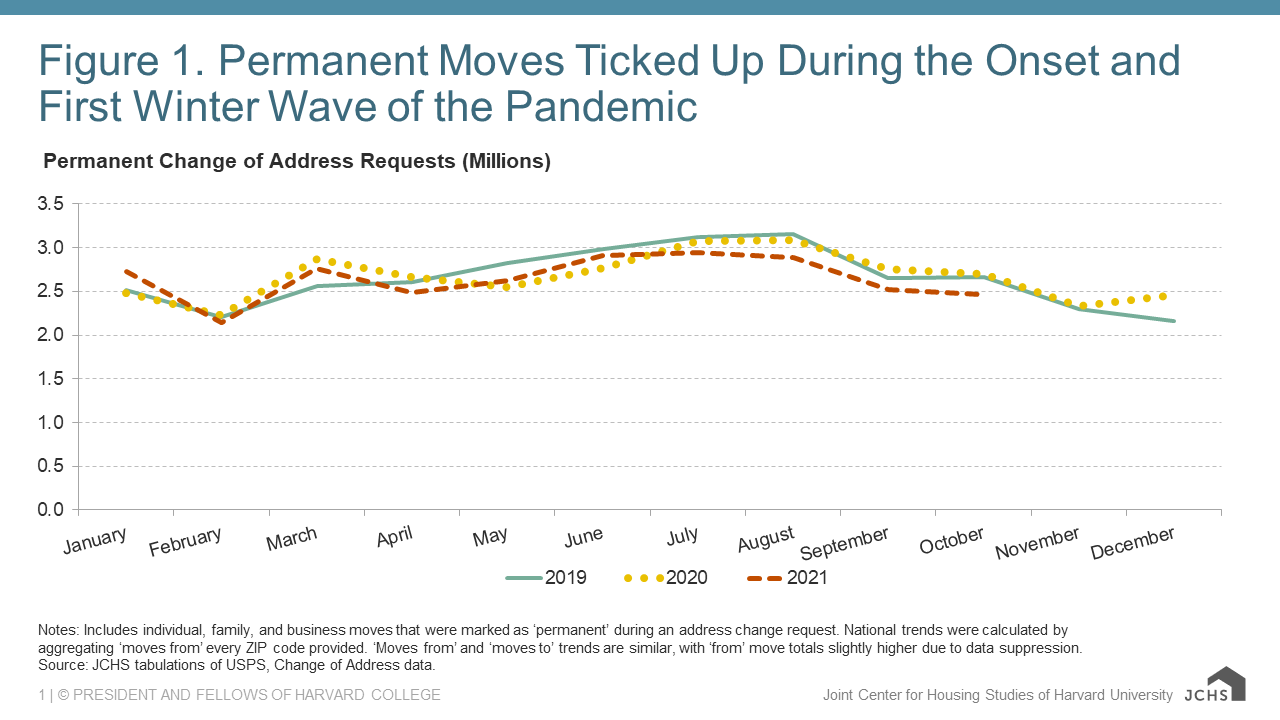
Notes: Includes individual, family, and business moves that were marked as ‘permanent’ during an address change request. National trends were calculated by aggregating ‘moves from’ every ZIP code provided. ‘Moves from’ and ‘moves to’ trends are similar, with ‘from’ move totals slightly higher due to data suppression.
Source: JCHS tabulations of USPS, Change of Address data.
There was a similar spike in temporary moves in early 2020, and trends remained elevated for the rest of the year. In March and April 2020, there were 224,000 and 86,000 more moves than one year prior, representing increases of 188 percent (a high percentage due to the typically low number of temporary moves in a month) and 36 percent, respectively. Overall, 2020 had about 446,000 more temporary moves than 2019, an increase of about 18 percent, though the monthly trend did hew to pre-pandemic patterns after April. These patterns continued in the first ten months of 2021, which had only 3 percent more temporary moves than the same span in 2019 (Figure 2).
Figure 2. Temporary Moves Spiked Early in the Pandemic and Remained Elevated Until Mid-2021
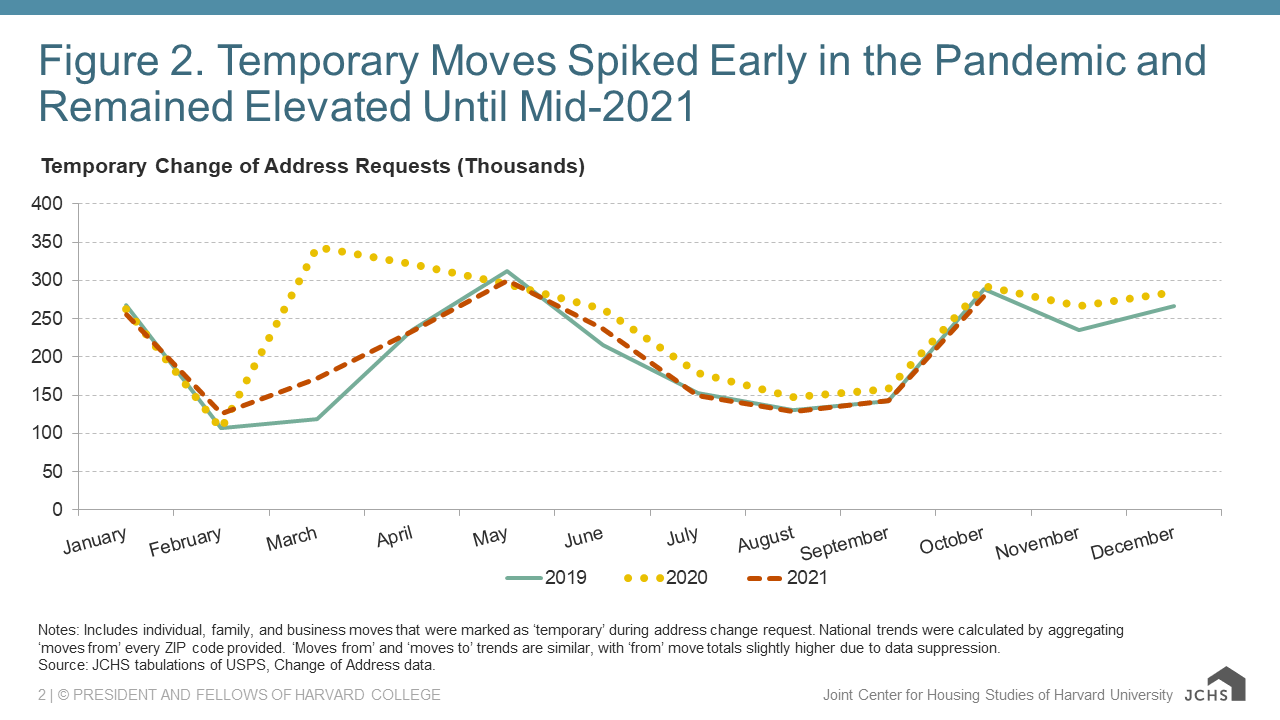
Notes: Includes individual, family, and business moves that were marked as ‘temporary’ during address change request. National trends were calculated by aggregating ‘moves from’ every ZIP code provided. ‘Moves from’ and ‘moves to’ trends are similar, with ‘from’ move totals slightly higher due to data suppression.
Source: JCHS tabulations of USPS, Change of Address data.
Because of the structure of the data from USPS, both the permanent and temporary move counts contain individual, family, and business moves, and it is not possible to break these types out. Likewise, the available data on individual, family, and business moves cannot be broken down by permanent or temporary moves. However, I can tell that most change of address requests are for individuals (23 million in 2019; 67 percent of the year total), followed by families (10 million in 2019; 30 percent), then by businesses (900,000 in 2019; 3 percent). Business moves did spike by 90,000 in March 2020, so businesses are partly responsible for the aforementioned increases in moves but they are still a minority of these increases.
What is particularly interesting for housing is that while individual moves went up at key points in the pandemic, family moves went down. There were nearly 400,000 more individual moves in March 2020, 250,000 more moves in April 2020, and 250,000 more moves in December 2020 compared to the same months in 2019. These were increases of 22 percent, 14 percent, and 16 percent, respectively, and overall individual moves were 5 percent higher in 2020 than 2019 (Figure 3). Individual moves remained elevated in early 2021 before dropping, with 19.27 million moves in January–October 2021, nearly identical to the total number (19.30 million) for the same span in 2019.
Figure 3. Individual Moves Have Been Elevated During the Pandemic

Notes: Includes permanent and temporary address change requests for individual moves. National trends were calculated by aggregating ‘moves from’ every ZIP code provided. ‘Moves from’ and ‘moves to’ trends are similar, with ‘from’ move totals slightly higher due to data suppression.
Source: JCHS tabulations of USPS, Change of Address data.
Meanwhile, family moves ticked up slightly in March 2020 by 40,000, a five percent increase from March 2019, before plummeting below previous-year levels. In April and May 2020, there were 140,000 (16 percent) and 226,000 (23 percent) fewer family moves than in April and May 2019, respectively. Total family moves in 2020 were 7 percent lower than in 2019, and the first ten months of 2021 had 10 percent fewer family moves than the same span in 2019 (Figure 4). One possible explanation is that people who were able to move as individuals had more flexibility during the pandemic and responded by packing their bags, whereas people who would move as a family were less able to do so and responded by hunkering down (including, perhaps, the high number of households who refinanced their mortgages).
Figure 4. Family Moves Fell after the Onset of the Pandemic and Have Remained at Lower Levels
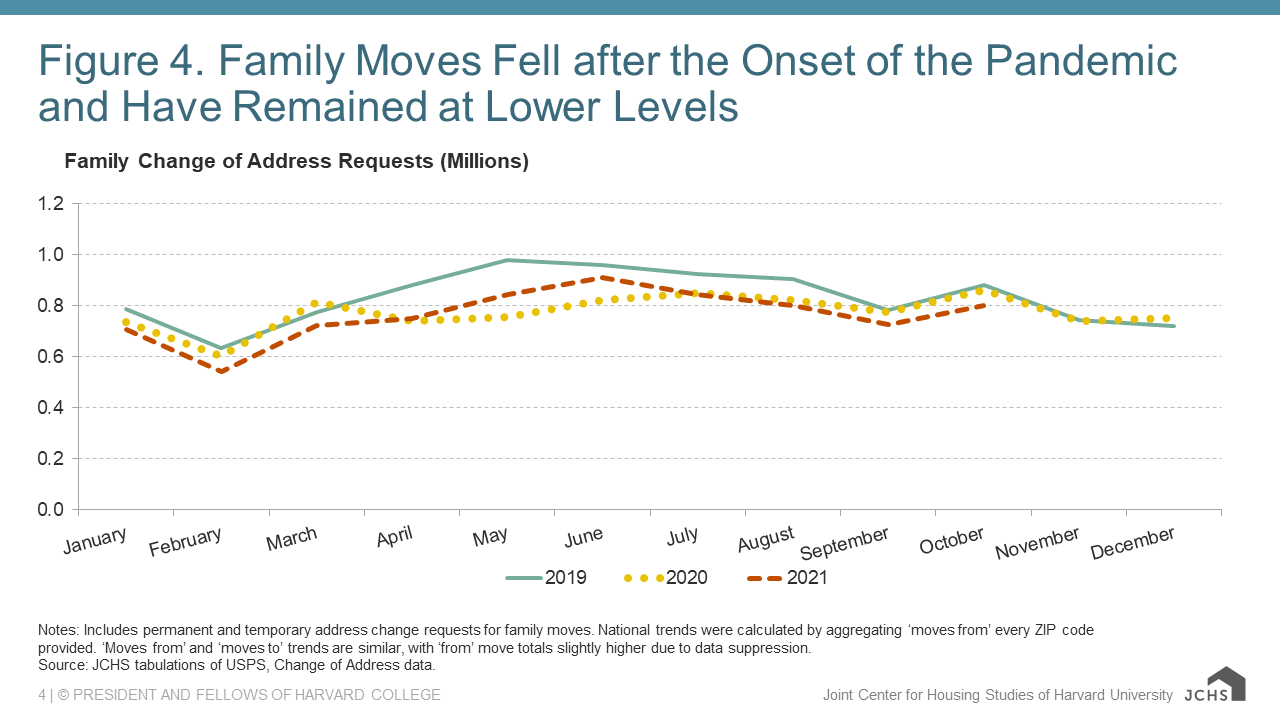
Notes: Includes permanent and temporary address change requests for family moves. National trends were calculated by aggregating ‘moves from’ every ZIP code provided. ‘Moves from’ and ‘moves to’ trends are similar, with ‘from’ move totals slightly higher due to data suppression.
Source: JCHS tabulations of USPS, Change of Address data.
These findings indicate that there were spikes in mobility during the pandemic, fitting the popular narratives that formed in the initial months, and show that these spikes were primarily among individuals and often temporary in nature. Indeed, of the 660,000 additional moves in 2020 compared to 2019, 440,000 were temporary moves. There is also evidence that during-pandemic moves had big effects on places, from housing markets to school enrollment. Additionally, the timing of mobility spikes during coronavirus surges implies that the movers behind them may have been fleeing high-case areas, moving in with family, or even responding to housing insecurity. The ‘stickiness’ of pre-pandemic trends, however, demonstrates that mobility is a multifaceted behavior that responds to a host of different factors—of which a world-upending pandemic is only one.