
As the Remodeling Industry Has Expanded, So Has Contractor Specialization and Scale
The amount spent by homeowners on improvements to their homes—remodels, replacements, additions, structural alterations, and other activities that increase the value of the housing stock—has doubled over the past two decades to more than $260 billion annually, an average increase of just over 2 percent per year after adjusting for the effects of inflation. In response to this growth, many contractors adopted new business models by limiting their offerings to more specialized services. In doing so they have been able to increase the efficiency and scale of their operations. As such, the home improvement industry is becoming more concentrated, with larger contractors garnering a larger share of overall market spending.
Our recent Improving America’s Housing 2021 report documents that annual spending on improvements to owner-occupied homes now exceeds $260 billion. The share of spending on improvements installed by professional contractors has grown steadily in recent decades. Twenty years ago, the pro share of project activity by dollar volume was roughly 75 percent, and the most recent data in 2019 had it climbing to a new high of almost 83 percent. The pro share almost certainly declined during the pandemic as do-it-yourself activity surged, but this is likely a short-term blip.
Annual Top 500 Remodelers rankings compiled by the industry trade publication Qualified Remodeler® for several decades have documented the performance of some of the largest remodeling contractors in the country. In 2001, design-build, full-service, and specialty replacement contractors ranked in the top 100 nationally by remodeling receipts had combined revenue that accounted for just 1.9 percent of all owner improvement spending for professionally installed projects, underscoring the reputation of this industry as one of the most fragmented in our economy (Figure 1). By 2019 the top 100 contractors accounted for almost double that share, increasing to 3.7 percent of national professional project spending.
Figure 1: Shares of Industry Revenue Increased for Top 100 Remodelers, But Remained Stable for Lower Ranked

Note: Top remodelers exclude those firms describing business as insurance restoration.
Source: JCHS tabulations of Qualified Remodeler® publication’s Top 500 Remodelers and HUD, American Housing Surveys.
However, the growing concentration in market activity has not run very deep. While the top 100 contractors saw their market share increase over this period, particularly following the 2008–09 Great Recession, the market share for the next tier of large-scale contractors saw almost no gains. Those ranked between number 101 and 500 on the Qualified Remodeler® list accounted for 1.1 percent of professional market spending in 2001, nearly exactly the same share in 2019 (1.0 percent).
The average remodeling revenue of the 20 design-build, full-service, and specialty replacement contractors that were ranked in the top 100 in 2001 and also reported results in 2019 (excluding other categories of business, contractors that ceased operations during this period, and those who did not submit for ranking consideration in 2019) increased from $27.1 million to $82.4 million, a jump of more than 200 percent (Figure 2). In comparison, total owner spending nationally on improvements to their homes just about doubled over this period, so larger contractors realized revenue gains on average of more than twice the growth in the overall industry.
Figure 2: Larger, More Specialized Remodeling Contractors Saw the Most Growth Over the Past Two Decades
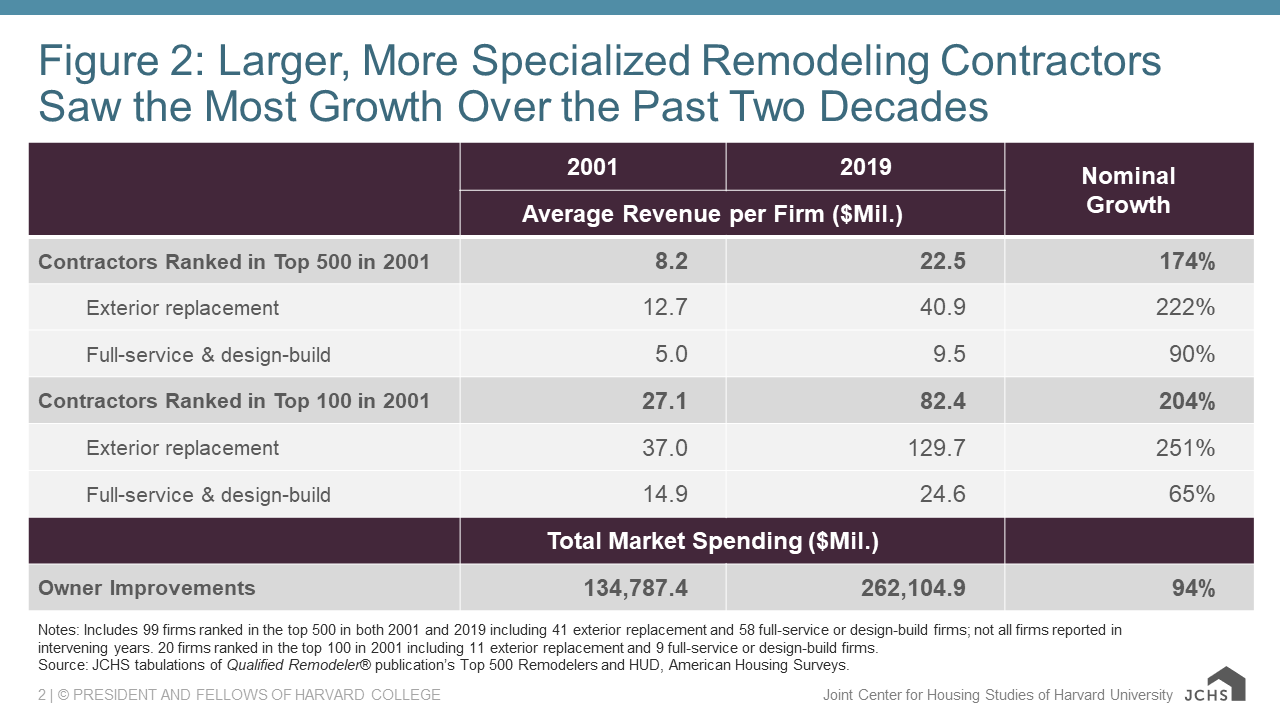
Notes: Includes 99 firms ranked in the top 500 in both 2001 and 2019 including 41 exterior replacement and 58 full-service or design-build firms; not all firms reported in intervening years. 20 firms ranked in the top 100 in 2001 including 11 exterior replacement and 9 full-service or design-build firms.
Source: JCHS tabulations of Qualified Remodeler® publication’s Top 500 Remodelers and HUD, American Housing Surveys.
However, contractor size is not the only factor associated with above-average growth for large-scale remodelers over this period. The past two decades have seen a move toward specialization among contactors in the remodeling industry. Some of the most common categories of contractor specialties are within the exterior replacements segment: roofing, siding, windows and doors, and other exterior components. Indeed, these project categories account for about 20 percent of all spending annually by owners on improvements.
Average revenue for exterior replacement contractors on the Qualified Remodeler® list that reported in both 2001 and 2019 increased from $12.7 million to $40.9 million, a 220 percent increase. In contrast, full-service and design-build contractors (which typically have designers on staff to develop plans for more complicated projects) saw their average revenue increase from $5.0 million to $9.5 million, a 90 percent increase over this period.
This comparison of the average revenue growth among specialty replacement contractors contrasted with their full-service and design-build counterparts suggests that a remodeling contractor’s specialization, at least for exterior replacement products, was more critical than their size in explaining performance. Indeed, average revenue growth for exterior replacement contractors that ranked in the top 100 in 2001 was over 250 percent by 2019. In contrast, growth for full-service and design-build contractors that ranked in the top 100 in 2001 was a relatively disappointing 65 percent by 2019.
Though still extremely fragmented, the home improvement industry has seen growing levels of concentration over the past two decades. Most of this concentration is the result of the growth of a few large businesses serving the industry. These larger businesses have the resources for more sophisticated marketing programs, typically are in a better financial position to withstand the challenges of the inevitable business cycle, and generally have a broader client mix that helps generate a more stable income stream.
However, specialization might also be a major avenue of growth for these larger remodeling companies. By concentrating on a relatively narrow project mix, contractors can develop the processes to manage and install certain kinds of home improvement projects more efficiently, thereby increasing the productivity of their workforce. They can also market more effectively because of the targeted project base they serve. So, as specialized firms become more prevalent in key industry sectors, the average size of remodeling contractors should continue to increase.