
Specialty Replacement Remodelers Likely to See More Consistent Business Performance During Market Downturn
As the residential remodeling industry is once again mired in a slump, we expect many home improvement contracting businesses will experience declining workloads and revenue that may lead to staff layoffs and even business closure. However, not all firms will be impacted by the market downturn comparably; business performance trends over past remodeling cycles—periods of boom, bust, and recovery—provide valuable insights for how industry structure might change in the coming months and years. Even during periods of strong market spending, remodeling business failure rates are relatively high but some types of remodelers tend to fare better than others, including larger-scale contractors and those focused on specialty replacement projects like roofing, windows and doors, plumbing and HVAC, electrical, etc.
Residential remodeling is a highly fragmented industry with many small, single-location businesses and self-employed contractors. Our Remodeling Futures Program estimates that fully two-thirds of the approximately 800,000 contracting businesses primarily serving the residential remodeling market have no employees, while more than half of remodeling businesses with payrolls have less than $250,000 in annual revenues. Indeed, remodeling contracting businesses face many obstacles to scaling, such as low barriers to entry, volatile business cycles, highly customized work, idiosyncratic local building codes, and difficulty attracting capital. For these reasons, business failure rates for remodelers are higher and more cyclical than other industries within the construction sector, or compared to US businesses overall (Figure 1).
Figure 1: Annual Business Failure Rates for Residential Remodelers Are Relatively High and Cyclical
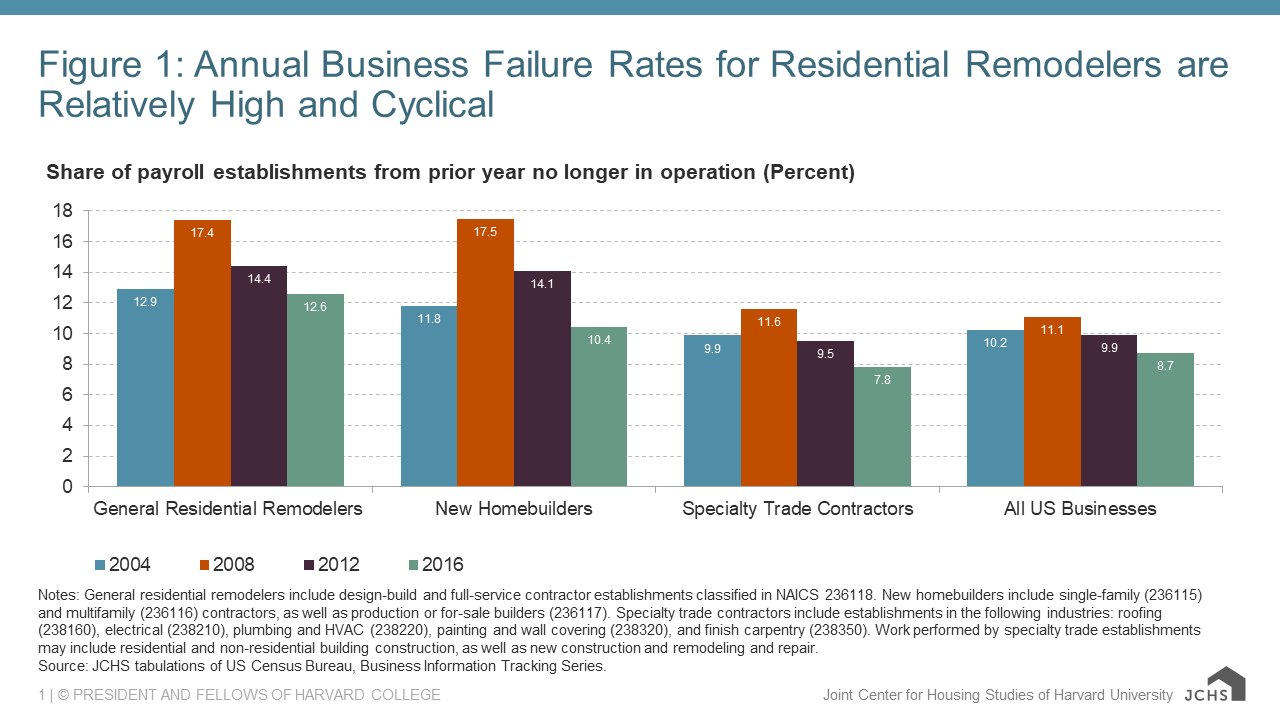
Notes: General residential remodelers include design-build and full-service contractor establishments classified in NAICS 236118. New homebuilders include single-family (236115) and multifamily (236116) contractors, as well as production or for-sale builders (236117). Specialty trade contractors include establishments in the following industries: roofing (238160), electrical (238210), plumbing and HVAC (238220), painting and wall covering (238320), and finish carpentry (238350). Work performed by specialty trade establishments may include residential and non-residential building construction, as well as new construction and remodeling and repair.
Source: JCHS tabulations of US Census Bureau, Business Information Tracking Series.
Whether the national economy is expanding, contracting, or somewhere in between, the share of general residential remodelers shuttering their operations from one year to another is considerably higher than annual failure rates of all businesses with payrolls. In 2004, the housing and home improvement industries were booming, but one in eight remodeling businesses failed that year, compared to one in ten payroll firms overall in the US. In 2008, with the onset of the Great Recession, annual failure rates of general remodelers rose sharply to 17 percent, whereas the failure rate of all payroll businesses increased by less than a percentage point to 11 percent. Even at last measure in 2016, a year of healthy market spending, almost 13 percent of remodelers closed compared to less than 9 percent of businesses overall in the US.
Within the construction sector, annual failure rates among new homebuilders are as high and cyclical as general remodelers, but specialty trade contractors experience lower and more stable failure rates across the business cycle. In 2004, fewer than 10 percent of specialty trade businesses ceased operations, rising to not quite 12 percent during the Great Recession, and dipping even below the rate for all US businesses in 2016. Part of the explanation for relatively lower and more stable failure rates among specialty trade contractors is the diversity of their work in residential and non-residential construction—both new construction and renovation of existing structures—as well as their relative ease in serving more than one construction subsector.
While general remodelers suffer relatively high failure rates overall, there is a large difference in business closure by size of company: the smallest remodelers routinely experience failure rates several times higher than the largest remodelers (Figure 2). Again, regardless of time period and market strength, smaller general remodeling contractors with less than $50,000 in payrolls see annual business failure rates about 8 times higher than the largest remodelers with payrolls of $250,000 or more. These largest-scale remodelers have annual failure rates of about 2.5 percent compared to upwards of 20 percent for the smallest remodelers. Furthermore, failure rates of larger-scale remodelers also vary considerably less over the business cycle than smaller-scale contractors.
Figure 2: Larger Remodeling Contractors Experience Much Lower Annual Rates of Business Failure
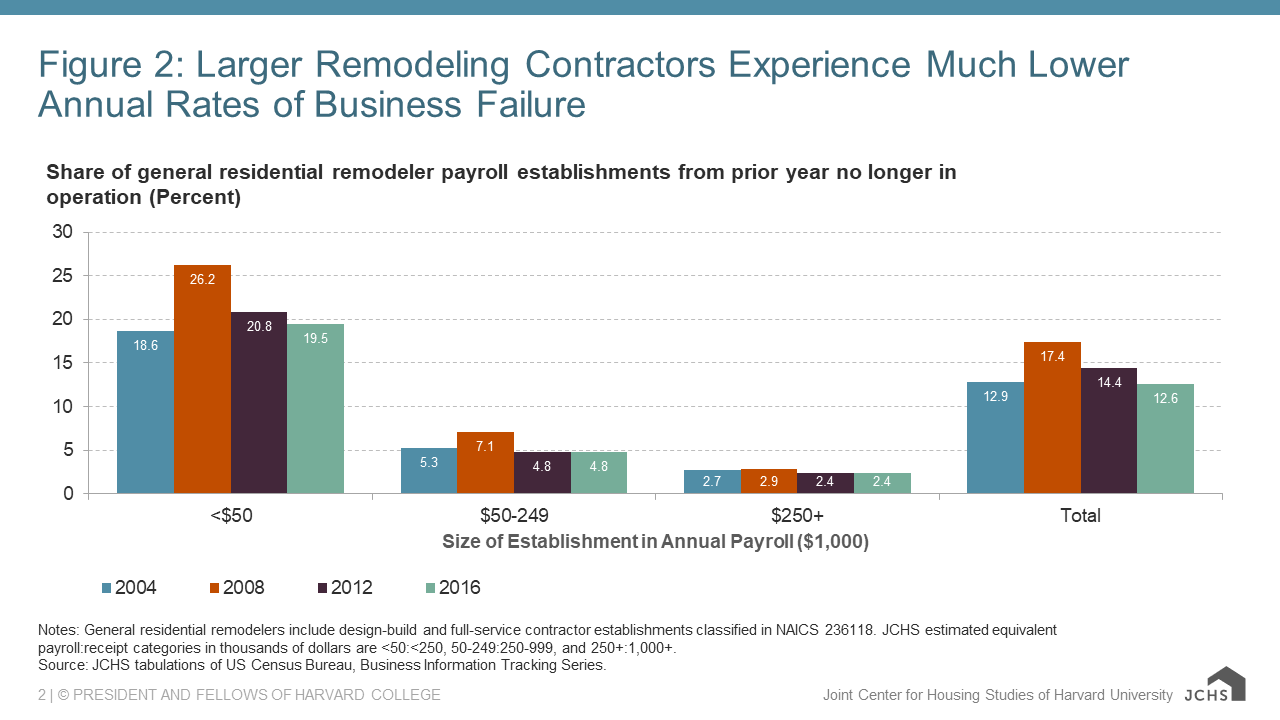
Notes: General residential remodelers include design-build and full-service contractor establishments classified in NAICS 236118. JCHS estimated equivalent payroll:receipt categories in thousands of dollars are <50:<250, 50-249:250-999, and 250+:1,000+.
Source: JCHS tabulations of US Census Bureau, Business Information Tracking Series.
While comparable failure rates are not available for residential remodelers focused on specialty replacement projects, business performance data collected from Qualified Remodeler® publication’s Top 500 Remodelers list suggest that specialty trade remodelers may have the same low and stable failure rates as specialty contractors overall. According to our analysis of revenue growth and firm type among larger-scale remodelers, specialty replacement remodelers perform more consistently across volatile business cycles compared to general remodelers (Figure 3). From 2001-06, as the home improvement market was booming, the typical large-scale specialty replacement remodeler posted 5.3 percent average annual revenue growth, comparable to the 6.9 percent average annual growth of the typical large-scale design/build or full-service remodeling firm. However, during the prior market bust from 2007-12, specialty remodelers experienced smaller revenue declines at 1.1 percent per year on average, compared to 2.3 percent for the typical general remodeler. And during the recovery period from 2013-18, the typical larger-scale specialty replacement remodeler posted much stronger growth at 9.2 percent on average each year compared to 6.8 percent for the typical design/build or full-service remodeler.
Figure 3: Specialty Replacement Remodelers Have Performed More Evenly Across Cycles than Design/Build and Full-Service Firms
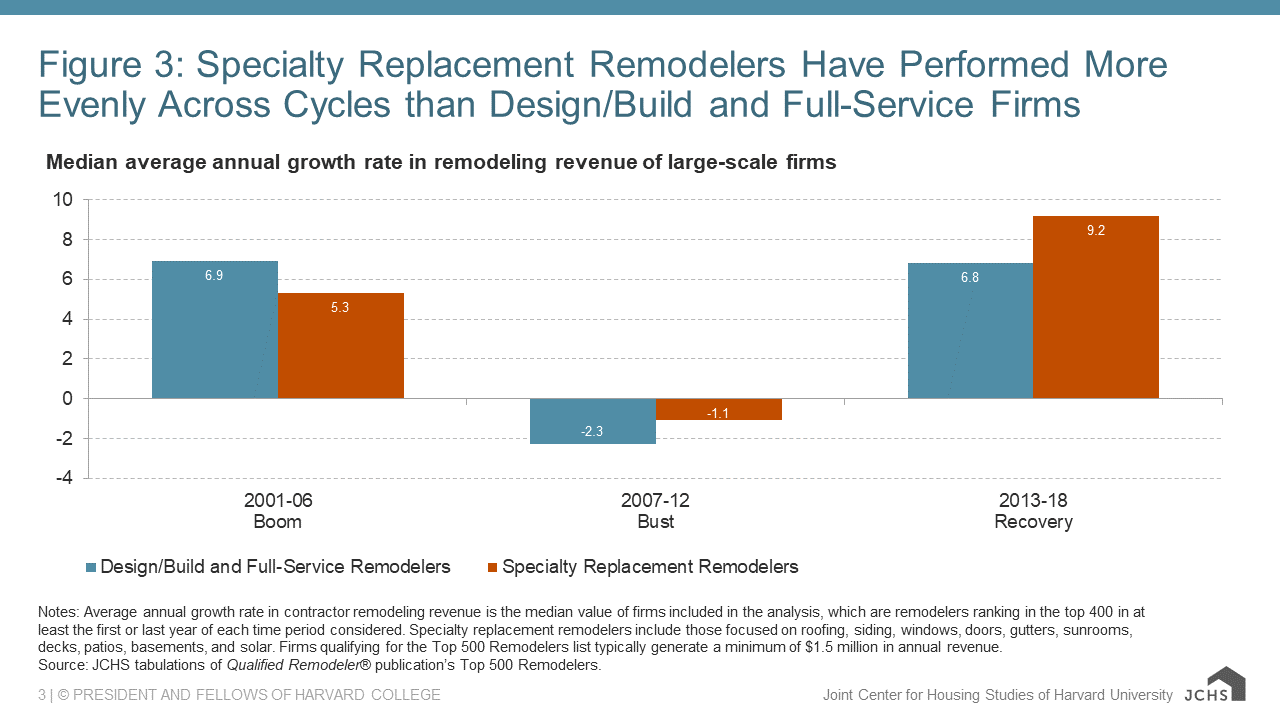
Notes: Average annual growth rate in contractor remodeling revenue is the median value of firms included in the analysis, which are remodelers ranking in the top 400 in at least the first or last year of each time period considered. Specialty replacement remodelers include those focused on roofing, siding, windows, doors, gutters, sunrooms, decks, patios, basements, and solar. Firms qualifying for the Top 500 Remodelers list typically generate a minimum of $1.5 million in annual revenue.
Source: JCHS tabulations of Qualified Remodeler® publication’s Top 500 Remodelers.
The more stable changes in revenue—and presumably lower and more stable business failure rates—among specialty replacement remodelers are supported by homeowners’ more consistent spending for replacement and repair projects regardless of market upturns and downturn, as explained by my colleague Kermit Baker. During challenging economic times, homeowners often defer spending for discretionary home improvements (especially upper-end projects, like major kitchen and bath remodels and room additions), and instead prioritize necessary replacements that preserve the value of their home—the single largest source of wealth for the typical homeowner. Indeed, our analysis of survey data capturing the early impacts of the pandemic on remodeling contracting businesses found that both larger remodelers and those focused on exterior projects like roofing, windows, landscaping, decking, etc. were less likely to report reduced project requests, smaller project sizes, and stopped or delayed work this spring. While the current spending slump will certainly result in larger shares of remodeling firm closures, specialty replacement remodelers—with more consistent business demand and revenues—are expected to fare better.