
Losing Residents but Still Growing: How Migration and Population Change Affect Cities
When I present research on residential mobility and migration in the United States, people are often surprised by the fact that many major US cities are growing but also losing people to domestic migration. This can be understood by looking closer at population change, which has two major components: migration and natural population change. The former consists of domestic and international inflows and outflows, and the latter is calculated by subtracting the number of deaths from the number of births. The US Census Bureau’s Population Estimates Program calculates and estimates these components down to the county level and as the interactive map below shows, the maps of migration, natural population change, and total population change can look quite different:
Figure 1: Migration and Population Change (2018)
In 2018, population increased in about 56 percent of all counties, and fell in the remaining 44 percent. However, of the 68 counties classified as ‘large central metro’ in the NCHS Urban-Rural Classification Scheme, fully 75 percent (51 counties) experienced population growth in 2018, despite the fact that only 52 percent (35 counties) had positive net migration (domestic + international), and nearly 77 percent (52 counties) saw negative net domestic migration. This illustrates the important roles of international migration and natural population change to the growth of major urban areas.
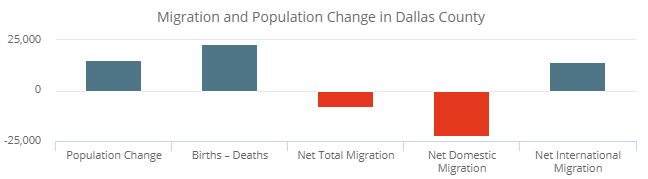
Nearly one-quarter of large central metro counties (16 counties) lost migrants overall but still grew in 2018 due to their natural population increases, including the counties containing Philadelphia, Cincinnati, Houston, Dallas, and San Diego. To illustrate, consider the case of Dallas County, Texas, which has 2.6 million residents, 1.3 million of whom live in the city of Dallas. Between 2017 and 2018, the county gained nearly 15,000 people. This population growth was due to a natural population increase of 23,000 (i.e. 23,000 more births than deaths) and the fact that international migration stemmed some of the loss of migrants from the county. Dallas County lost over 22,000 people to domestic migration but gained over 14,000 people from international migration, leading to a total negative net migration of 8,000 (see these details by hovering over and/or clicking on a county on the map above).
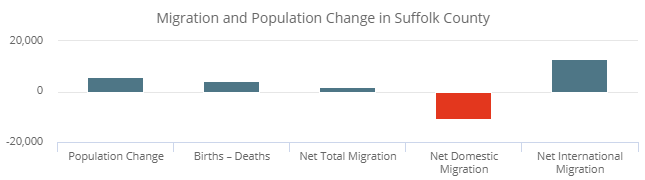
For some large urban counties, international migration makes up for the loss in domestic migrants. Around 28 percent of large urban counties (19 counties) lost people to domestic migration but gained a sufficiently large number of immigrants to create positive overall migration in 2018, including the counties that contain Miami, Columbus, Boston, Seattle, Salt Lake City, and Washington, DC. Suffolk County, Massachusetts has around 800,000 residents, the majority of whom live in the city of Boston. In 2018, Suffolk County lost over 11,000 people to domestic migration but gained nearly 13,000 people to international migration. Added to the natural population increase of 4,000, the total population change in the county in 2018 was an increase of nearly 6,000 people.
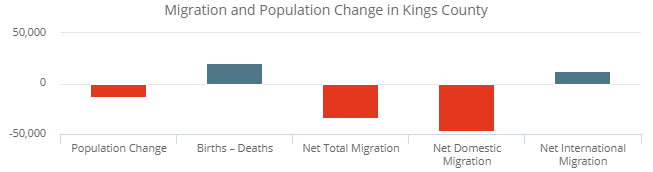
Natural population growth and strong international migration do not always make up for the loss of residents to domestic migration, however. In 2018, 25 percent of large central metro counties (17 counties) experienced natural population growth but overall population decline due to negative net migration, including the counties containing Los Angeles, Chicago, Milwaukee, Cleveland, and every borough of New York besides Staten Island. In Kings County, New York (Brooklyn), there were over 12,000 residents gained from international migration but over 46,000 residents lost to domestic migration. The natural population growth of 21,000 could not offset these losses, and the population declined by nearly 14,000 people in 2018. It is worth noting that this population loss represents a small portion of the overall population in Kings County, which was estimated at 2.6 million in 2018.
Understanding how the components of population change differ by place is important for understanding exactly how each community is evolving, and where people are drawn when they are either moving within the country or from outside the country. As the map shows, many large central metro counties are attracting numerous international migrants, while many nearby suburban areas (referred to as ‘large fringe metro’ in the NCHS classification) are attracting sizable numbers of domestic migrants. And counties in many high-cost metropolitan areas are losing more domestic migrants than they are gaining. Indeed, of the 100 most populous US metros, four of the five with the highest rates of renter cost burdens also have negative domestic migration. These data reveal much about the location decisions of Americans, as well as the natural population changes, regardless of how recently they moved—which is important to understand, in light of near-record lows in residential mobility.