
Nearly a Third of American Households Were Cost-Burdened Last Year
The share of US households facing housing cost burdens fell slightly last year, according to JCHS analysis of newly-released data from the 2017 American Community Survey. The percent of households with cost burdens (paying more than 30 percent of their total household income for housing) declined from 32.0 percent in 2016 to 31.5 percent in 2017 (37.8 million households). The share facing severe housing cost burdens (paying more than 50 percent of their income for housing) also fell slightly, declining from 15.6 percent in 2016 to 15.2 percent in 2017 (18.2 million households). However, despite the decrease in cost-burdened households last year, the share of such households remains larger than in 2001.
These declines occurred among both renters and homeowners and appear to be driven by recent increases in household incomes. Among renters, the share of cost-burdened households declined from 47.5 percent in 2016 to 47.4 percent in 2017 (20.5 million households), and the share of severely cost-burdened renters declined from 25.2 percent in 2016 to 24.9 percent in 2017 (10.8 million households). During this period, the median rent payment (rent plus utilities) among renter households increased from $1000 in 2016 to $1,010 in 2017, but the median income among renters increased from $37,791 in 2016 to $38,300 in 2017.
Among homeowners, the share of cost-burdened households declined from 23.0 percent in 2016 to 22.5 percent in 2017 (17.3 million households), and the share of severely cost-burdened owners declined from 10.0 percent in 2016 to 9.7 percent in 2017 (7.5 million households). Similarly, the median monthly payment (mortgage plus property tax, property insurance, and mortgage insurance) among homeowner households decreased from $1085 in 2016 to $1,080 in 2017, but the median income increased from $74,152 in 2016 to $75,000 in 2017.
Table 1: Cost-Burdened Households (Thousands)
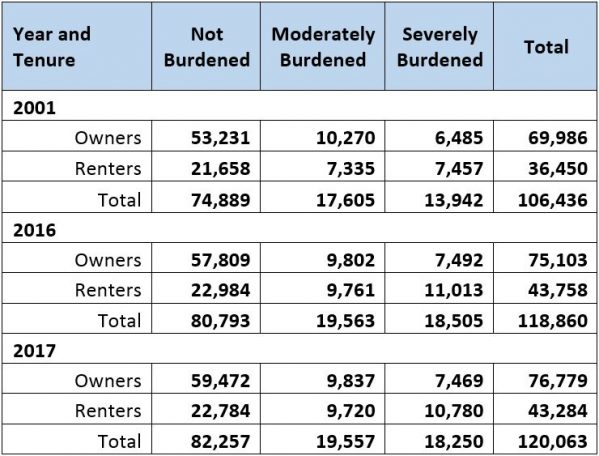
Source: JCHS tabulations of US Census, American Community Survey 1-Year Estimates
Table 2: Share of Cost-Burdened Households (Percent)
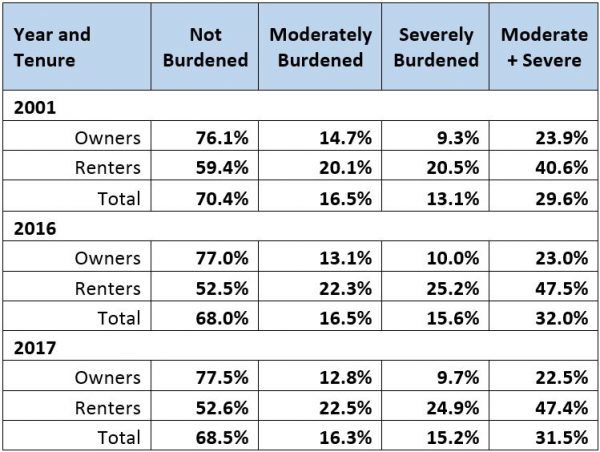
Source: JCHS tabulations of US Census, American Community Survey 1-Year Estimates
While these recent declines in housing cost burdens are a positive trend, they are not large enough to offset the substantial increase in cost burdens since 2001, particularly among renters. The share of renter households with housing cost burdens in 2017 is 6.8 percent (5.7 million households) above the 2001 level of 40.6 percent (14.8 million). This difference reflects the sharp increase in housing cost burdens among renter households between 2001 and the peak of 50.8 percent in 2011, with recent declines only slightly lowering this figure to 47.4 percent in 2017.
Lastly, the 2017 data show that housing cost burdens are nearly universal among the lowest-income households, including both homeowners and renters. Among renter households in 2017 with incomes below $15,000, 82.8 percent (83.8 percent for homeowners) were housing cost burdened and 71.7 percent (67.9 percent of homeowners) were severely cost burdened. These high levels of burden underscore the difficulty for households with the lowest incomes to find housing in the private market.
Because housing units often cannot be supplied at rents affordable to households with the lowest incomes, reducing the extent of severe housing cost burdens requires strategies that increase the availability of housing assistance, or increase these households’ incomes. At higher income levels, greater production of housing units at all price points also has a role to play in reversing the longer-term rise in housing cost burdens since 2001.